Crypto Academy Week 14 - Homework Post for @fendit
Hello Steemians. Another wonderful week in the Crypto Academy. This week, professor @fendit gave detailed explanation on another instrument for technical analysis called the EWT, which stands for Elliott Wave Theory. Without any waste of time, I would be handling the assignment tasks.
Elliot Wave Theory
The Elliott Wave Theory is simply the identification of recurring patterns in a price chart. These patterns are applied in predicting price movement in market.
The Elliott Wave Theory is based on crowd psychology. This means that the wave movement is influenced by actions investors take in the market during particular market situations.

Application of the Elliot Wave Theory
Trend Identification: The major uses of technical indicators is for identification of trends. This helps traders to know the right time to make entries and to know when to exit a market.
Profit Maximization and Loss Minimization: The EWT is used to get the best profit from a trade. Reading the patterns accurately will help traders know the best time to enter a position and make exits in the market in respect to the trend.
Identification of Trends Reversals:
The EWT helps traders to know when there's a possible trend reversal. Traders may join a bullish trend at the wrong time during the fifth wave or the "A" wave with the thought that the price would keep going up. The EWT helps prevent these mistakes.For Identifying when an Asset is Overbought:
Lack of knowledge on the EWT would make most traders to make an entry during an overbought situation. The EWT would help investors to identify overbought regions and this would ensure that the traders do not make rash decisions.Combination with with other indicators such as the RSI and the MACD:
The EWT can be better used when combined with the RSI and MACD. The RSI can be used to confirm overbought and oversold patterns in the EWT. The crossing of the MACD lines can also be used to confirm patterns in different scenarios.
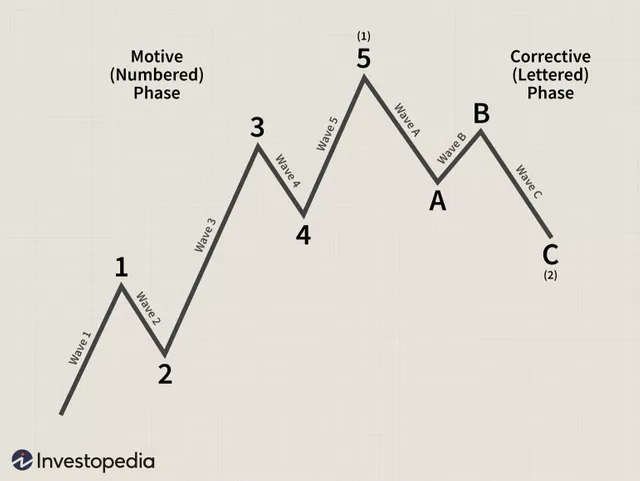
Impulsive and Corrective Waves
BULLISH TREND
source
:max_bytes(150000):strip_icc():format(webp)/ElliottWaveTheory-b46a288b1cfe42c69bdbf3b502849b2c.png)
BEARISH TREND
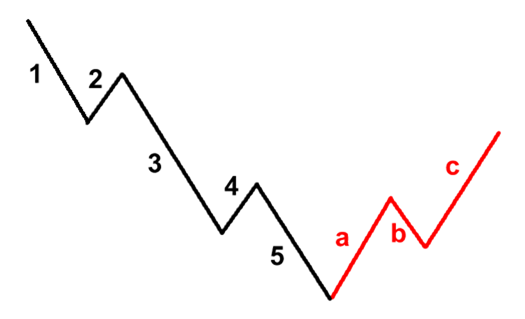
Impulsive Wave
The Elliott Wave Theory consists of eight (8) waves. The impulsive waves are the first 5 waves. These waves always move in the direction of a particular trend and are the easiest to identify.
Using a bullish trend;
Wave 1: This is the first wave in the EWT. This wave moves in the direction of the trend because investors are gradually getting into the market.
Wave 2: This is the second wave in the pattern. It is a little drop in the price of the market. This is because investors are selling their positions inorder to take profits.
Wave 3: The third wave in the pattern shows a great increase in price. This is because investors observed the market during the first wave and were looking for an opportunity to make an entry. They make their entries after the second wave which results in a very great price increases in wave 3.
Wave 4: This wave shows another regression. This is because investors sell their positions to make profit at this stage. The regression is little because most investors would choose to hold in hopes of another rise in price.
Wave 5: At this point more investors join the market in hopes of joining the trend. The asset becomes overvalued in this situation. Chances of obtaining profit are slim at this point.
Corrective Wave
The beginning of a corrective wave marks the reversal of the market trend. They are three in number and are identified with the letters A, B and C to make them differentiable from the impulsive waves.
How to Identify the Different Waves
Rule 1: The retracement of wave 2 cannot go past the beginning of wave 1.
Rule 2: Wave 3 is the longest wave and cannot be shorter than any wave.
Rule 3: Wave 4 does not regress to the price level of wave 1.
Rule 4: Wave 5 always ends with a momentum divergence ( e.g bullish divergence and bearish divergence). This would be confirmed with the use of other indicators.
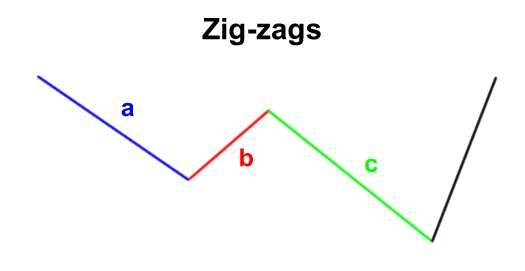
The corrective waves are classified into the different patterns. They are as follows:
Zig-zag Pattern: To identify this pattern, wave B would be shorter than wave A and wave C.
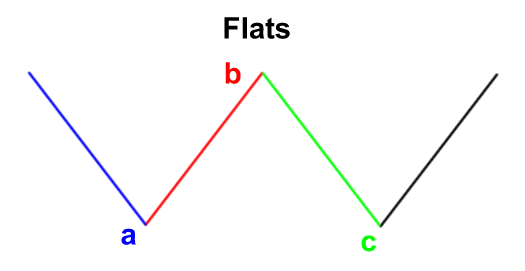
sourceFlat Pattern: This pattern is very easy to identify. In this pattern, all the waves have equal lengths.
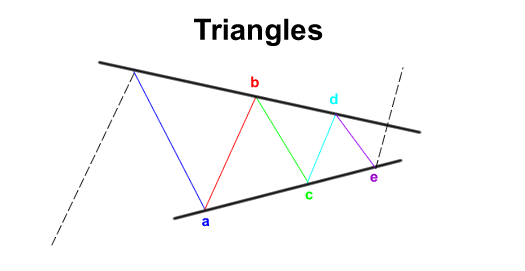
sourceTriangle Pattern: This is identified by a convergence or divergence in the wave pattern to form a triangle. Unlike the flat Pattern, the triangle pattern is difficult to identify.
source
My Thoughts on the Elliott Wave Theory
Technical analysis tools have all proved to be very important, but none of them have a basis of principle like EWT. The EWT uses crowd psychology to determine patterns. These patterns are then used to make predictions in the market. Using a theory based on the thinking of the majority is very proficient.
Although the EWA is very useful, it has its shortcomings. It is difficult to read patterns especially if one is a newbie to trading. There's a saying that the patterns cannot be fully determined unless they have been completed. This makes the EWA a difficult tool to use.
My verdict is that the EWA is a good tool for technical analysis. All that's needed is familiarity and experience in reading the patterns.
Elliott Wave in the BTCUSDT Pair
I'll be using the BTCUSDT pair for my illustration because of the high volatility of the market.
The image below illustrates the Elliott Wave Theory in a bearish trend.
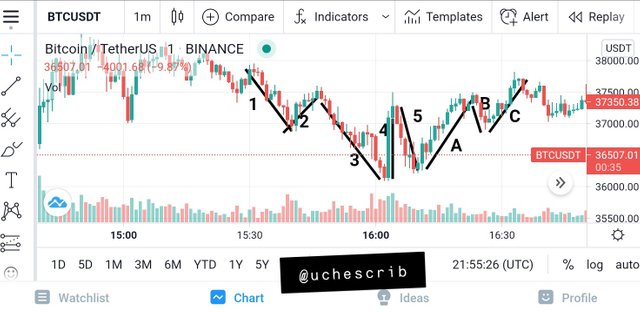
Taking the waves one after the order;
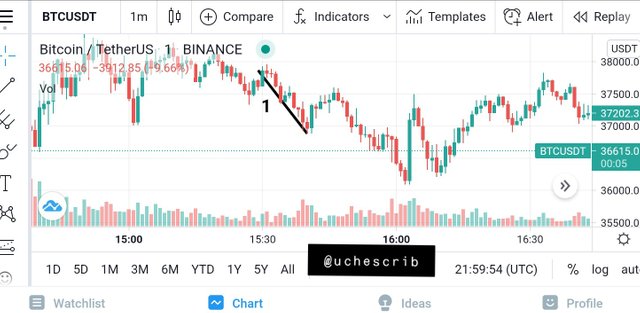
Wave 1
The trend begins in a drop in the price because investors sell their positions.
Wave 2
At this wave, the price increases because investors rush to buy at a cheap price.
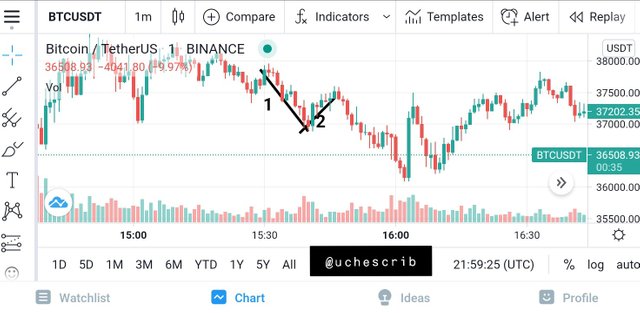
Wave 3
Another downward slope is observed because traders rush to sell their positions because of the little rise in price. This causes the market to drop in price. Notice that this wave is longer than the previous two. This is an indicator of a correct Elliott Wave Theory, but still needs confirmation with wave 4.
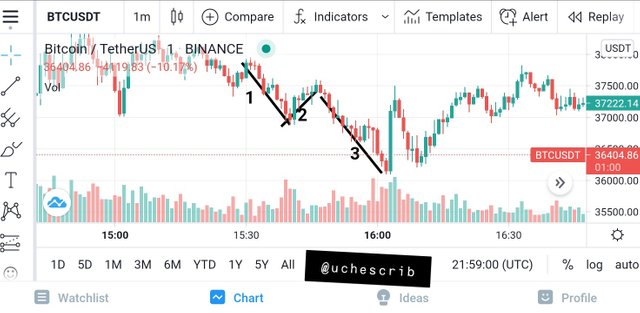
Wave 4
An opportunity to buy opens up and this causes a retracement in the chart. Investors begin to buy at a low price.
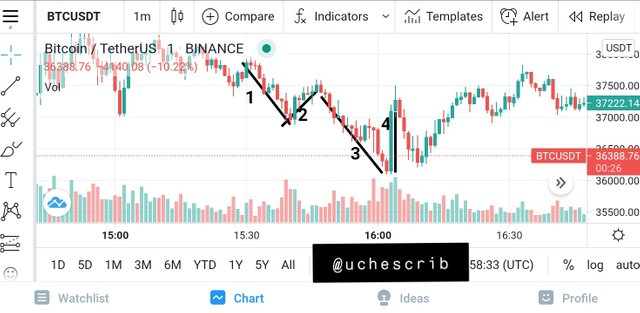
Wave 5
Recall the market was initially in a bearish trend. At this point, investors decide to completely exit the market and own their losses.
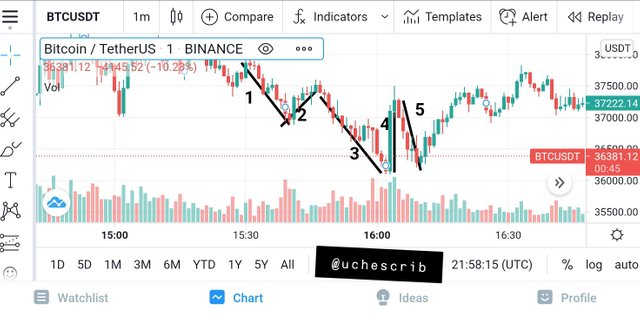
Wave A
This is an indicator for a reversal in market trend. Bullish investors enter the market and buy positions at cheap prices.
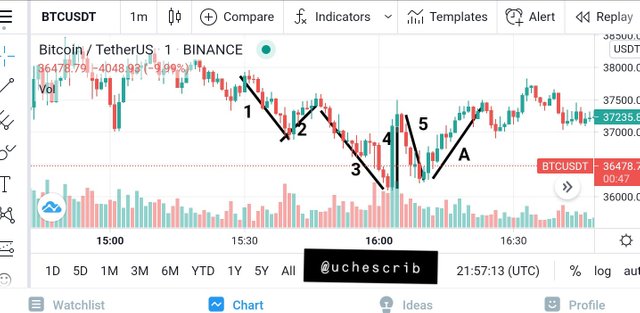
Wave B
The price goes down a little because a minority of the investors decide to take profit
Wave C
Investors begin to buy positions in the market which causes a bullish trend in the market.
I believe that most people would say that it is better to open a position on wave 3. I would say that the wave 3 is not a guarantee that the chart would follow the Elliott Wave Theory. In my opinion, it is better to wait for wave 4 in order to confirm if that particular wave would be longer than wave 3.
If wave 4 isn't longer, then the chart is following the Elliott Wave Theory. With this development, the best place to open a position in the market would be during the regression at wave 5. This is because a trend reversal is expected after the regression.
Conclusion
The Elliott Wave Theory has been used for decades and this is proof of how useful it is and has been in technical analysis. Every trader should remember that no tool offers total accuracy. As a result of this, it is best to combine various technical indicators in order to make the the best decisions.
Special thanks to @fendit
Thank you for being part of my lecture and completing the task!
My comments:
Nice work,
the analysis was a bit brief and I believe you could have deepen it a bit more, but overall it was ok!
Overall score:
6/10
Thank you for the review. I'd do better next time