BTC 저점 형성, 축적 시작
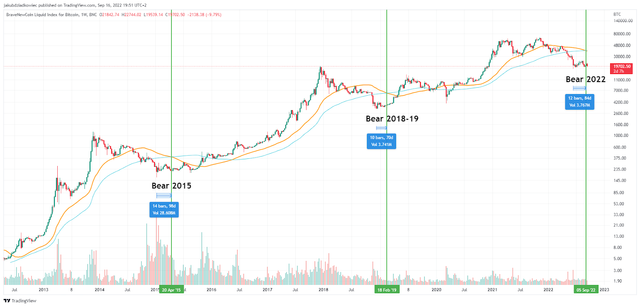
역대 3번째로 50주 이동평균선(Moving Average, MA)이 100주 이동평균선의 아래에 위치하기 시작한 약세 크로스(bearish cross)가 지난 8월 5일 발생했습니다.
이는 BTC 가격이 바닥이며 축적 단계에 들어섰음을 나타냅니다. 앞서 발생한 2차례의 약세 크로스는 2015년 4월 20일, 2019년 2월 18일에 발생했으며, 각각 BTC가 바닥에 도달한지 14주, 10주 만에 발생했습니다. 이번에도 BTC가 18000달러선을 하회했던 6월 이후 12 주 만에 발생했습니다.
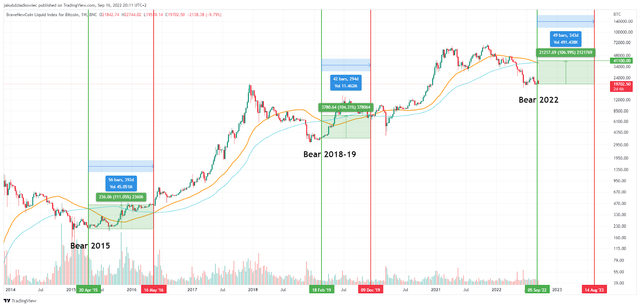
앞선 두차례 각각 약세 크로스가 발생한지 56주, 42주 만인 2016년 5월 16일, 2019년 12월 9일에 강세 크로스(bullish cross)가 발생했으며, 당시 가격은 데드크로스 대비 111%, 104% 상승했습니다.
이를 현재에 적용해보면, 이번 강세 크로스는 49주 후인 2023년 8월 14일 발생하며 BTC의 가격은 약 107.5% 상승한 41,100 달러로 예상할 수 있습니다.
For the third time in history, two important moving averages made a bearish intersection on the Bitcoin (BTC) chart. Paradoxically, this could be a very bullish signal! Historically, it has led to large increases and initiated an accumulation phase before the next bull market.
Long-term moving averages like to stay away from each other. However, from time to time they intersect, often defining turning points on the chart of an asset. On Bitcoin’s chart, the 50-week and 100-week moving averages (50W MA and 100W MA) serve such a function.
On August 5, an important technical event occurred on the BTC chart. Two important moving averages made a bearish cross. The 50W MA fell below the 100W MA. This was the 3rd such situation in the entire history of BTC trading (green lines).
Previously, this signal appeared twice: on April 20, 2015, and on February 18, 2019. In both cases, the intersection occurred a dozen weeks after Bitcoin reached the absolute bottom of the bear market. The same is true this time:
2015: 14 weeks / 98 days from the bottom at $164
2019: 10 weeks / 70 days from the bottom at $3,148
2022: 12 weeks / 84 days from the bottom at $17,607
Looking further at this signal, one can trace what happened next. The next major event was a bullish cross when the 50W MA returned above the 100W MA. This has happened twice so far: on May 16, 2016, and on December 9, 2019 (red lines).
After the week in which the bearish cross occurred, the BTC price went through a phase of accumulation and increase. From 2015-2016, it surged by 111% during this period, while in 2019 it increased by 104%. Meanwhile, the time separating the two signals was 56 and 42 weeks, respectively.
Now, if we would like to extrapolate this scant data to the current chart, we can attempt to calculate the price of BTC and the time it will reach the next bullish cross. Averaging the historical data on the upside we get 107.5%, and on time we get 49 weeks.
This gives us a very rough prediction of the BTC price at $41,100, which would be reached on August 14, 2023. What’s more, a bullish cross between the 50W MA and 100W MA in the long term led to increases.
Reference
Bitcoin (BTC) Gets Third-Ever Bullish Signal From These Two Moving Averages
Upvoted! Thank you for supporting witness @jswit.
@feelsogood.cur transfered 2.16 KRWP to @krwp.burn. voting percent : 73.95%, voting power : 20.98%, steem power : 2037224.19, STU KRW : 1200.
@feelsogood.cur staking status : 2160 KRWP
@feelsogood.cur limit for KRWP voting service : 2.16 KRWP (rate : 0.001)
What you sent : 2.16 KRWP [67794176 - c6d24ad4f92f50facbf0c2c60a9d116b4532b7cf]