SEC S19W4 || Mastering the Sharkfin Model for Trading
This is my homework post for Steemit Crypto Academy Season 19 Week 4, Mastering the Sharkfin Model for Trading.
Image is clickable and might show larger resolution.
Note : I performed this task on Windows 10 PC, Google Chrome.
Task 1 - Explain the concept of the Sharkfin model. What is a Sharkfin pattern and how can it be identified on a price chart? Describe its main visual characteristics.
What is A Sharkfin (or Shark Fin) Pattern
Shark Fin Pattern is a term used in technical analysis of trading price charts to describe a sharp and rapid price movement pattern resembling the shape of a shark fin. This pattern can appear in various assets, such as stocks, currencies, or commodities, and is usually associated with significant price changes in a short period. Technically, the Shark Fin pattern is used to identify rapid changes in market sentiment that affect prices very quickly, often triggered by specific news or events. With it, traders can get early signals, helping them decide position whether to buy or sell. As the name suggests, the Shark Fin pattern has a shape similar to a sharp angle, resembling a V in an uptrend and an inverted V in a downtrend, just like shark fin.
Characteristics of the Shark Fin Pattern
- Rapid Price Increase. The asset's price rises sharply and quickly, creating a shape that resembles the first part of a shark fin. This occurs when there is a significant increase in demand or buying interest. It can be triggered by positive news, strong financial reports, or market speculation. This increase usually happens within a short period, causing the asset's price to surge dramatically.
- Rapid Price Drop. After reaching the peak, the price drops quickly, forming the second part of the fin. This decline can occur due to heavy selling or profit-taking by traders. It can also be triggered by negative news or a swift change in market sentiment.
- High Trading Volume. This pattern is often accompanied by high trading volume (buying or selling), especially when the price reaches its peak.
- High Volatility. The pattern indicates high volatility, meaning prices can change drastically within a short period, which can be risky for traders. This volatility makes the Shark Fin pattern an intriguing but high-risk opportunity.
Usage in Trading
The Shark Fin pattern is often used by traders to identify short-term trading opportunities. For example, they might try to sell an asset as its price approaches the peak of the "fin" or buy back when the price drops sharply. However, due to the high volatility, this pattern can also be risky. The usefulness of the Shark Fin pattern lies in its early indication and warning of trend changes and serves as a signal for setting up sell or buy positions.
- Reversal Indicator. The Shark Fin Pattern is often considered a sign of a trend reversal. When this pattern appears, traders may anticipate the end of a strong upward trend and the beginning of a downward trend, or vice versa.
- Sell or Buy Signals. Traders using this pattern can take a sell position when the price nears the peak, or buy back quickly when the price drops.

How Can It Be Identified on A Price Chart
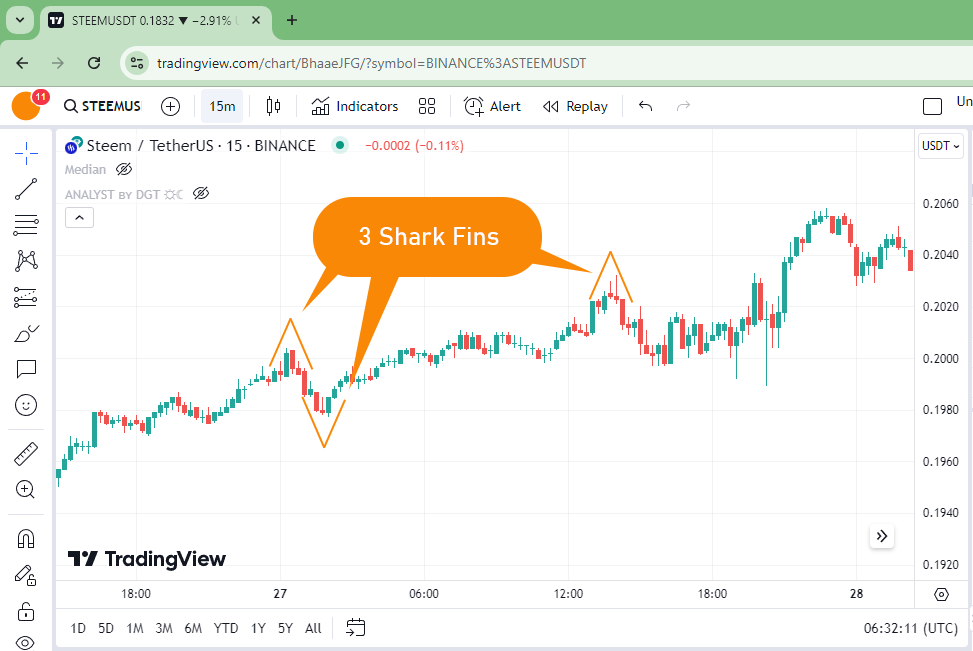
To identify the Shark Fin pattern on a price chart on an uptrend, a trader should look for the following characteristics and steps:
- Observe Sharp Price Increase. Look for a rapid price movement upward within a short period. This usually indicates strong buying interest, potentially influenced by positive news or other factors.
- Identify the Peak. Find the point on the chart where the price reaches its highest level before starting to decline. This peak represents the top of the "shark fin."
- Watch for a Sharp Drop. After the price hits the peak, check for a rapid price drop. This decline should be steep enough to form the bottom part of the Shark Fin pattern.
Let’s take a look at this screenshot of STEEMUSDT chart on 15 minutes trading on Binance as seen on TradingView.

Task 2 - Explain how the RSI (Relative Strength Index) indicator can be used to identify Sharkfin patterns. Give a real-world example of RSI metrics (like overbought and oversold levels) and explain how these metrics help spot Sharkfins.
What Is RSI (Relative Strength Index)
Before we discuss how the Relative Strength Index (RSI) helps traders identify the Shark Fin pattern, let's first briefly review the history of the Relative Strength Index and what it exactly is.

The history of RSI (Relative Strength Index) is indeed fascinating. It was developed by J. Welles Wilder, Jr. and introduced in his influential book, "New Concepts in Technical Trading Systems", published in 1978. Wilder, a renowned trader and author, is also known for creating other significant technical indicators like the Average True Range (ATR) and the Parabolic SAR.
BARRON'S, an American weekly magazine/newspaper published by Dow Jones & Company, a division of News Corp, since 1921, in July 1984 stated that, I quote, “In 1978, the basis of mathematical analysis was expanded when J. Welles Wilder, Jr. published New Concepts in Technical Trading Systems.”
How to Use RSI (Relative Strength Index) to Identify Shark Fin Patterns
RSI is part of a series of indicators Wilder developed to assist traders with technical analysis. The core idea behind RSI is to measure the speed and change of price movements, providing insight into the strength or weakness of a price trend, which can aid in trading decisions. Since its introduction, RSI has become one of the most popular and widely used technical indicators in market analysis.
Even though RSI (Relative Strength Index) was not specifically designed to identify the Sharkfin pattern, traders can use it partially or alongside other indicators to help confirm signals from the pattern. Here’s a general approach to using RSI in identifying the Shark Fin Pattern:
- Identify the Shark Fin Pattern. First, look for the Shark Fin pattern on the price chart. This pattern typically shows a sharp peak (like a shark fin) followed by a price decline. It often appears after a strong upward trend. It has been discussed above on Task 1 of this assignment.
- Analyze RSI. Once the Shark Fin pattern is identified, check the RSI for confirmation. Here are some aspects to consider:
- RSI Overbought/Oversold. Ensure that the RSI shows an overbought condition (above 70) when the Shark Fin pattern forms. This indicates that the price might be too high and could soon decline. The same applies when the RSI indicates an oversold condition (below 30), which can suggest that the price is too low and might soon change direction. This could signal a potential buying opportunity, as the market may be poised for a reversal to the upside. Therefore, when identifying the Shark Fin pattern, if the RSI is in oversold territory, it can confirm that the asset may be undervalued and due for a price increase.
- Divergence. Look for divergences between the RSI and the price chart. For example, if the price makes a new peak but the RSI does not follow suit and instead starts to decline, this could signal that the Shark Fin pattern might indicate a change in direction.
A Real-World Example of RSI Metrics (Overbought and Oversold Levels) and How These Metrics Help Spot Shark Fins
Overbought Real Case Example
Let's take a look at the ETHBTC chart on the Binance spot market with a 15-minute trading interval, using the RSI to confirm the Shark Fin pattern.
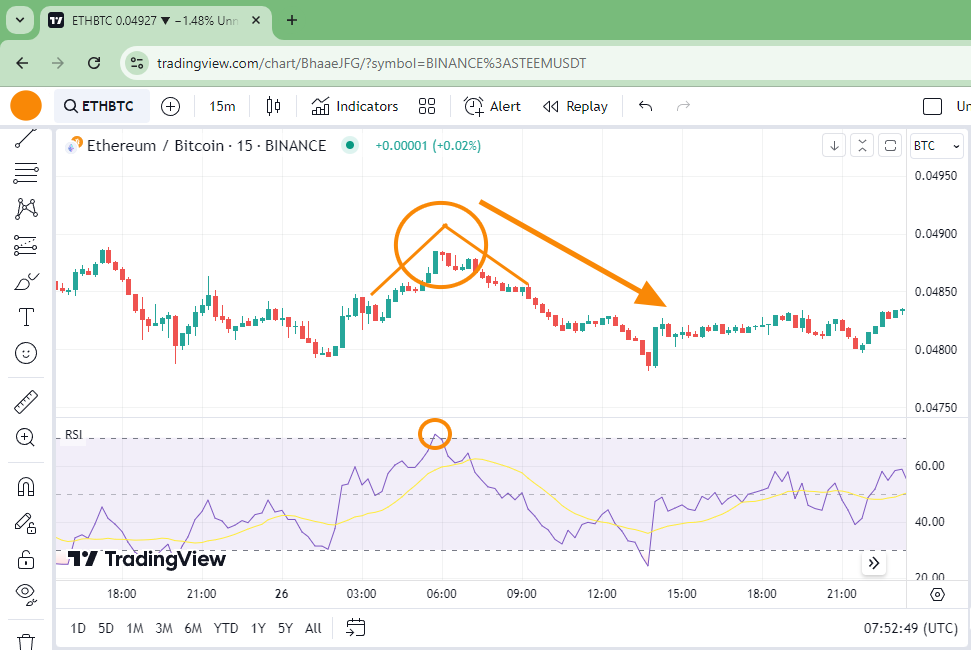
The image above shows the appearance of Shark Fin pattern which was confirmed by the Relative Strength Index overbought metric (above 70). The chart shows that the price continued to decline after the Shark Fin pattern, which was confirmed by the RSI.
Oversold Real Case Example
Now, let's look at the opposite case, where a Shark Fin pattern indicates a price reversal to the upside after a decline. We will use the same image.
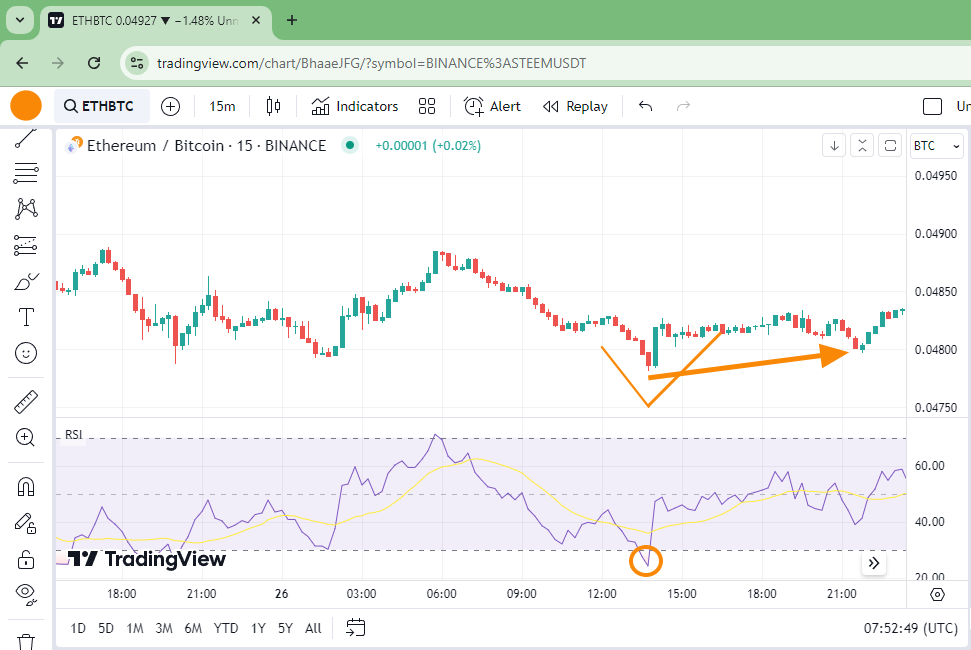
We can see in the image above that after a Shark Fin pattern was confirmed during a downtrend, the price immediately started to rise.
Task 3 - What are the trade entry criteria when using the Sharkfin model applied to the Steem token? Describe the specific signals you are looking for before entering a position, using example price setups and indicators.
The Trade Entry Criteria When Using the Sharkfin Model Applied To The STEEM Token
Determining the entry point using the Shark Fin pattern involves ensuring that the signal is strong enough to indicate a confirmed price reversal. In an uptrend (bullish), when the RSI line has crossed above 70, indicating an overbought condition, traders should be prepared for a potential quick price drop and consider taking a short position at the right time. Conversely, in a bearish market (downtrend), when the RSI line crosses below 30, indicating an oversold condition, the price could start rising at any moment. Therefore, there are three steps to set the entry criteria in trading, including when applied to the STEEM token:
- Identify the Peak or Bottom. After the price reaches a peak or bottom (crosses the top or bottom line), wait for confirmation that the trend has reversed.
- Confirm the Price Trend Reversal. Confirmation can come from a strong bearish candle, a moving average crossover, or signals from other technical indicators (such as RSI or MACD) showing that the momentum is starting to shift.
- Entry Point. Enter a short or long position after the reversal confirmation, as the price begins to move in the opposite direction.
Specific Signals I Am Looking for Before Entering a Position
Using the Shark Fin pattern with the assistance of RSI, the signal I look for and rely on is the confirmation of a price trend change. This occurs after the price crosses the upper and lower thresholds, at which point I wait for the RSI to confirm the price change, indicated by the formation of a sharp angle resembling a V or an inverted V. I believe this is the right time to determine a position. However, since cryptocurrency trading carries high risk, I still need to practice risk management to minimize potential losses if unfavorable events occur swiftly. I will set a Stop-Loss and Target Profit to address this.
Let’s see the STEEMUSDT Chart from TradingView in a 5 minutes interval trading below:
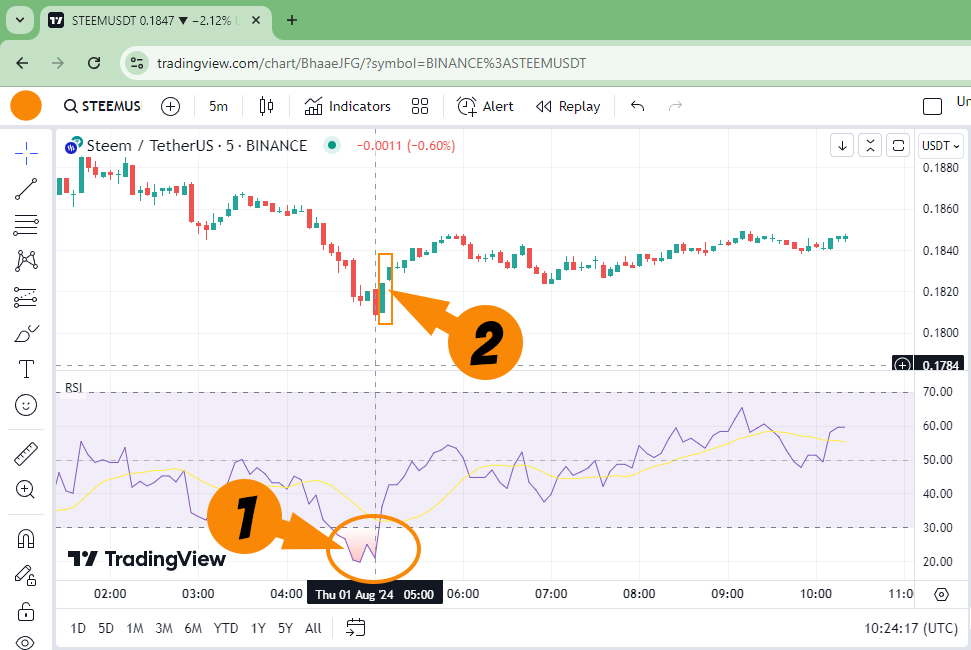
The image shows that in a bearish position when there is an oversold condition, price changes can occur suddenly. The Shark Fin pattern confirmed by the RSI happens at a low peak (1) and then reverses the price trend to an uptrend. When the first sign appears, I will refrain from entering a position. I will wait for 10 minutes or -in this case of 5 minutes interval trading- 2 candlesticks afterward to gain strong confidence that the trend change is confirmed (2). After that, I will enter the trade.
Task 4 - Describe the trade exit criteria for a Sharkfin model applied to the Steem token. What signals or conditions tell you it is time to exit a position?
Exit Criteria For a Shark fin Model Applied To The STEEM Token
Exit criteria are the rules set to exit a trade. They can be established to take profits when a target profit is reached or to cut losses when the price shows a tendency to continue declining. Examples of exit criteria include:
- Target Profit. Close the position when the price reaches the previously set target profit.
- Stop-Loss. Close the position if the price moves against the position and hits the stop-loss level to limit losses.
- Trend Reversal. Close the position when technical signals indicate that the trend is reversing (e.g., Moving Average crossover or reversal candlestick patterns).
- Time-Based Exit. Close the position after a certain period, such as after one trading day.
These criteria are applicable to all traded tokens, including STEEM.
Signals or Conditions to Exit a position
I believe the most important signals for exiting a trade are when there is a trend change from bullish to bearish, or when strong signals indicate that the price is likely to move sideways and decline rather than rise, and when the price hits the predetermined stop-loss or target-profit levels.
Task 5 - Show a detailed example of a transaction based on the Sharkfin model on the Steem token. Use real charts and historical data to illustrate your trade, including entry and exit points, and the reasoning behind each decision.
Let's look at the example case on the STEEMUSDT chart with a 15-minute interval on the Binance market via TradingView.
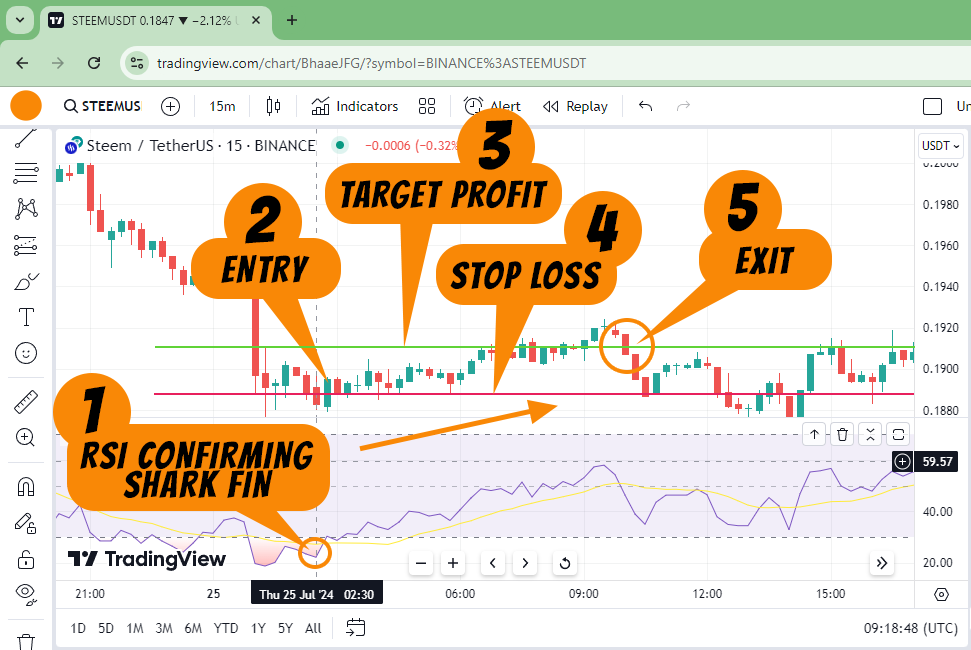
In the image, the RSI confirms that a Shark Fin pattern occurred in a bearish state at 02:30 on July 25, 2024, and the market later showed a trend reversal. I will wait for a moment and, after the next candlestick confirms the trend reversal signal, I will decide. On that day, STEEM was trading around 0.1882 and 0.1894 USDT. Therefore, I will buy at approximately 0.1890. Suppose I buy 1000 STEEM, which means I need to spend around 189 USDT.
After that, I will set a target profit at 0.1910 USDT (green line) and a stop-loss at 0.1850 USDT (red line). But of course, that's the plan. I will monitor the chart and observe the developments. As seen on the chart, 0.1910 is a safe target. When the price hits the target profit, and I notice the RSI line still suggests further increase, I choose to hold for a while (hodl). When the trend reverses and cuts through the target profit line at 10:00, I decide to exit. This means I have a profit of 0.02 USDT per STEEM, multiplied by 1000, which means I made a profit of 20 USDT with an investment of 189 USDT in about 8 hours.
Brief Conclusion on Shark Fin Pattern
Benefits
- Trend Reversal Identification. The Shark Fin Pattern can help identify potential trend reversals by observing sharp price spikes followed by rapid declines.
- Short-Term Trading Opportunities. This pattern often offers attractive short-term trading opportunities, both for long and short positions.
- Indicator of High Volatility. The pattern indicates high volatility, which can be exploited by risk-seeking traders.
Warnings
- High Risk. Due to sharp price movements, the Shark Fin Pattern can be highly risky if predictions are inaccurate.
- Need for Additional Confirmation. This pattern should be used with additional indicators or analysis to avoid false signals.
- Risk Management Is Crucial. Using stop-loss orders and good risk management practices is essential to protect against potential large losses.
The Shark Fin Pattern can be a useful tool in trading, but it should be used cautiously and with a solid risk management strategy.
Advice for Users of the Shark Fin Pattern
Since trading is a high-risk activity, it is recommended for users of the Shark Fin Pattern (actually, this advice applies to all patterns used in trading) to:
- Use Additional Confirmation. Don't rely solely on the Shark Fin Pattern. Use other technical indicators like Moving Averages, RSI, or MACD to confirm signals and avoid false signals.
- Implement Strict Risk Management. Using stop-loss is always important to limit potential losses. Given the high volatility associated with this pattern, a stop-loss can protect against unexpected price movements.
- Monitor Trading Volume. Always pay a clear attention at trading volume during the pattern formation. High volume at the peak can indicate a market turning point, providing additional confirmation for entry or exit.
- Stay Informed on News and Market Sentiment. Major news or economic events can significantly impact price movements. Always be aware of market sentiment and current news to avoid surprises.
- Use for Short-Term Trading. This pattern is more suitable for short-term trading due to rapid price changes. Set realistic profit targets and avoid holding positions for too long.
- Practice Emotional Control. This pattern can evoke strong emotions due to high volatility. Stay calm and disciplined with your trading plan.
- Conduct Backtesting and Historical Analysis. Before using this pattern in live trading, conduct backtesting on historical data to understand how the pattern behaves under different market conditions.
By following this advice, traders can use the Shark Fin Pattern more effectively and reduce the associated risks.
Thanks
Thanks @crypto-academy for the lesson.
Pictures Sources
- The editorial picture was created by me.
- Unless otherwise stated, all another pictures were screenshoots and were edited with Adobe Photoshop 2021.
Sources and Reading Suggestion
- gate.io : What Is SharkFin?;
- avatrade.com.au : RSI Indicator;
- Roboforex : How to Trade by the Shark Pattern?;
- TradingView : Shark pattern;
- tradingview.com : Jdawg TDI with Shark Fins;
- investopedia.com : Relative Strength Index (RSI) Indicator Explained With Formula;
- bions.id : Mengenal Relative Strength Index Rsi Dalam Investasi Saham Untuk Pemula;
- most.co.id : Chart Pattern yang Sering Ditemukan dalam Pergerakan Saham;
- https://en.wikipedia.org/wiki/J._Welles_Wilder_Jr.;
- https://www.deltasociety.com/content/about-welles-wilder;
- https://en.wikipedia.org/wiki/Barron's;
- tradingstrategyguides.com : RSI Trading Strategy – Master The 80-20 Strategy (Updated 2024);
- tradethepool.com : 6 Simple RSI Trading Strategies You Can Use Today;
- Investopedia.com : Mastering Short-Term Trading;
- cmcmarkets.com : Short-term trading;
- ig.com : Short-term trading strategies for beginners;
- Steemit.com : Hello Shark: Trading Shark Fin Patterns by @alphafx;
- Steemit.com : Crypto Academy Season 03 - Week 08 | Advanced Course - Trading Sharkfin Pattern by @cryptokraze;


Thank you, friend!


I'm @steem.history, who is steem witness.
Thank you for witnessvoting for me.
please click it!
(Go to https://steemit.com/~witnesses and type fbslo at the bottom of the page)
The weight is reduced because of the lack of Voting Power. If you vote for me as a witness, you can get my little vote.
Upvoted. Thank You for sending some of your rewards to @null. It will make Steem stronger.
thank you,, see you again maybe next week ?
!upvote 15
💯⚜2️⃣0️⃣2️⃣4️⃣ Participate in the "Seven Network" Community2️⃣0️⃣2️⃣4️⃣ ⚜💯.
This post was manually selected to be voted on by "Seven Network Project". (Manual Curation of Steem Seven).
the post has been upvoted successfully! Remaining bandwidth: 65%
thanks, boss
Your post has been rewarded by the Seven Team.
Support partner witnesses
We are the hope!
thanks, boss
This is detailed and insightful post on the Sharkfin model for trading. Your clear explanations and practical examples make it much easier to understand this model. I guess depending on individual Sharkfin model may not provide the exact signals, using it with indicator like RSI makes easy to understand the market setuation. I enjoyed reading this post.
Thanks stream4u.
As I mentioned in the article, we shouldn't rely on just one indicator; we should use multiple technical analysis tools and fundamental analysis to get a more accurate and comprehensive picture of an asset. This means confirming signals from one analysis tool with several other tools is important to do.
True.
Thanks.
https://x.com/aneukpineung78/status/1819809589833199641
Your understanding of the RSI indicator to spot overbought and oversold regions in the market and on the chart is amazing. You have indeed mastered this indicator and you have beautifully applied it to the chart to demonstrate your knowledge of the sharkfin model. Additionally, the reference materials you have provided are very usually for additional research. I wish you success, my friend.
You wrote excellent article too about this topic, Simon.
Your explanation can increase my knowledge about the correct way to trade by studying charts and other indicators.
Many beginners feel like they are gambling when trading in crypto because of a lack of knowledge. Even though everything has knowledge for us to learn.
Indeed, for me, this is also foundational knowledge when deciding to engage in trading. There are so many factors to consider to make a position profitable, but in many cases, not losing too much is also a form of profit.