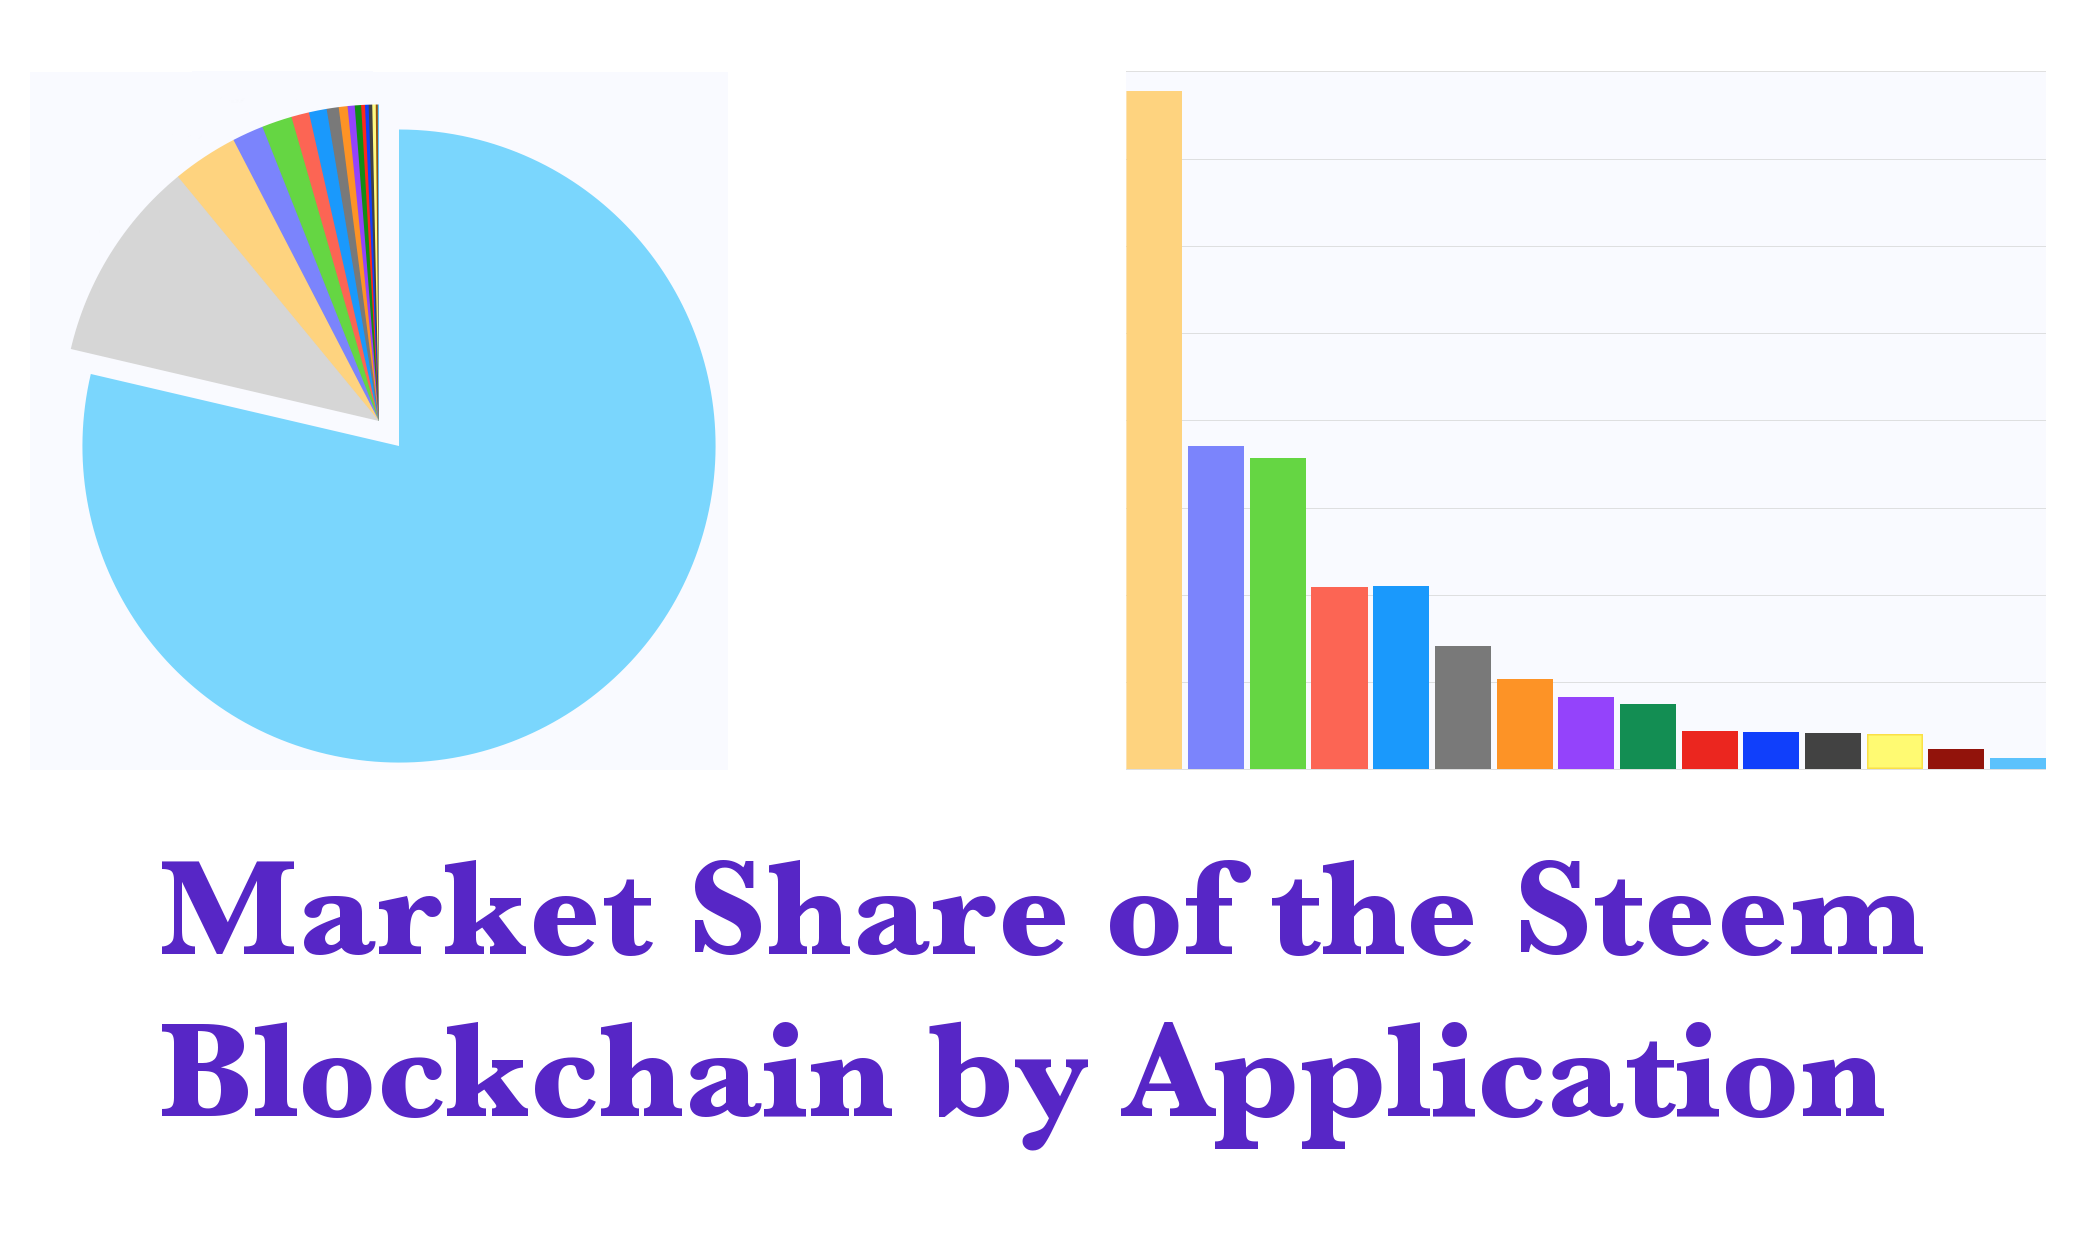
Views of the Market Share of the Steem Blockchain by Application
Stop right there. Don’t scroll down. How many different applications can you name for posting on the Steem blockchain? Can you get as high as ten? If so, I think you're doing pretty well. And how many have you used in the last thirty days? In all likelihood a maximum of two or three.
There are now more than sixteen different applications (or methods) for posting to the Steem blockchain (according to the data drawn from the steemsql database). And OK, some of these are a little niche, or even a little technical (or a lot!). But they're there. Ready when you are.
The rapidity with which the application infrastructure has grown around the Steem blockchain is nothing short of astonishing. Some of these platforms have been established for over a year; an eternity in the Steem blockchain timescale. Many others have sprung forth more recently, aided by the implementation in March of the beneficiary payment system. This update, part of Hard Fork 17, enabled third party developers to receive a share of the author payout from each post made through their application. Yet another incentive for developing around the Steem blockchain.
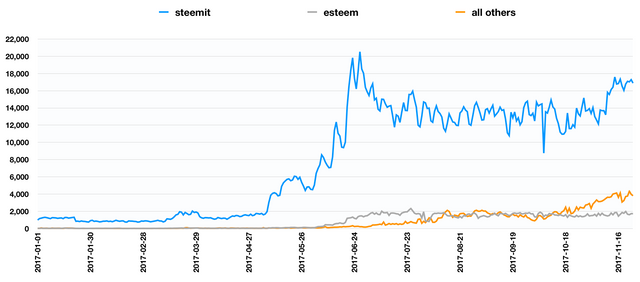
It seems to be bearing fruit. Let's take a look at the number of posts per day made to the Steem blockchain from applications across 2017. Steemit and eSteem, two of the longest established platforms, are still the market leaders but since June there has been a steady rise in the number of posts from other platforms.
So which platforms are capturing the market share of the blockchain? How do they all rank up? Well it depends upon which measure you use. Let's take a look at a few different approaches.
Regular Posters (4 or more posts in the last thirty days)
This is my own favourite. It represents users that are engaged in the platform, demonstrated by posting around once per week or more. Of course no measure is perfect and different platforms will attract different kinds of use. For example users may visit dtube every day and watch videos but not post, something which seems less likely with daily visitors to Steemit.
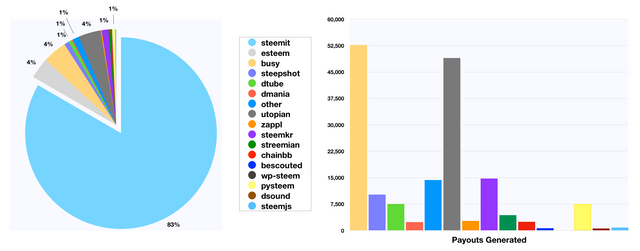
The pie chart on the left shows all the main applications, with Steemit at 79% of regular users and eSteem at 10%. The column chart on the right, which excludes Steemit and eSteem, shows busy.org, Steepshot, and dtube leading the chasing pack.
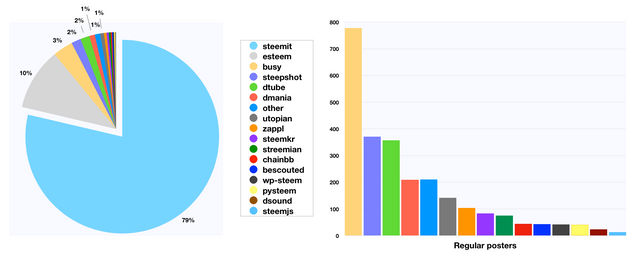
30 days measured from 25 October to 24 November - it's taken a while to put this all together!
A quick list of the more unusual apps / methods that you may not recognise:
- steemKR - A fork of Steemit (not of Steem) for the Korean market
- pysteem - I assume this is posts added with steem-python (the official python library for Steem)
- steemjs - I assume this is posts added with steem.js (the JavaScript library for the Steem blockchain)
- wp-steem - I assume this is WordPress Steem (posts published on Steem from WordPress)
- other - Mainly posts with no application marked in steemsql.
Post numbers
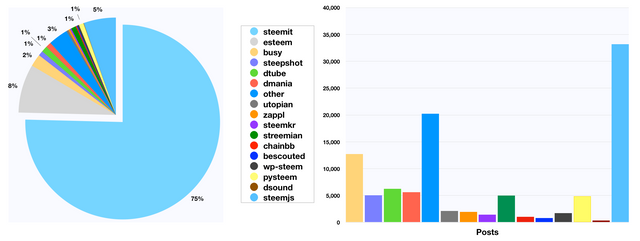
What about market share by total post numbers over the thirty days rather than user numbers? How does this differ?
We have the same two market leaders but now a significant difference in the chasing pack. Steem.js and "other" (mainly unknown) show very high post numbers in comparison to their user numbers. It's pretty easy to guess why, but that's a story for another day.
Post payout
Finally total post payouts over the thirty day period. This has been calculated as the sum of Author Payout, Curator Payout and Pending Payout (It does not include Beneficiary Payout which is harder to capture. Thus the figures for third party apps will be understated by a small percentage.)
Quite a different picture! While Steemit is still way ahead, busy.org, utopian.io and eSteem, are all very close together for second place. SteemKR is also showing up very well on this measure.
Of course a lot of these applications are new and still forging ahead with development. The trend for these newer apps is generally upwards and their user base and posting numbers are likely to increase with time. Overall it's a very healthy picture and an exciting time for the Steem blockchain!
The views in this article are my own. I have no affiliation with any of the application teams. The numbers in this article have been produced by an analysis of the Steem blockchain but have received no independent verification and as such should be treated with care.
Summaries of Results - Regular Posters and All Posters
| Application | Regular posters | Ranking | All posters | Ranking |
|---|---|---|---|---|
| steemit | 18,246 | 1 | 40,128 | 1 |
| esteem | 2,410 | 2 | 4,671 | 2 |
| busy | 778 | 3 | 1,598 | 3 |
| steepshot | 371 | 4 | 1,016 | 5 |
| dtube | 358 | 5 | 1,285 | 4 |
| dmania | 210 | 7 | 491 | 8 |
| other | 211 | 6 | 495 | 7 |
| utopian | 142 | 8 | 511 | 6 |
| zappl | 104 | 9 | 370 | 9 |
| steemkr | 84 | 10 | 157 | 10 |
| streemian | 75 | 11 | 114 | 14 |
| chainbb | 45 | 12 | 148 | 11 |
| bescouted | 43 | 13 | 72 | 16 |
| wp-steem | 42 | 14 | 86 | 15 |
| pysteem | 41 | 15 | 128 | 12 |
| dsound | 24 | 16 | 116 | 13 |
| steemjs | 14 | 17 | 21 | 17 |
| total | 23,198 | 51,407 |
Summaries of Results - Post numbers and Payouts Generated
| Application | Posts | Ranking | Payouts Generated | Ranking |
|---|---|---|---|---|
| steemit | 466,729 | 1 | 1,080,006 | 1 |
| esteem | 49,907 | 2 | 45,821 | 4 |
| busy | 12,716 | 5 | 52,632 | 2 |
| steepshot | 5,068 | 8 | 10,221 | 7 |
| dtube | 6,267 | 6 | 7,545 | 8 |
| dmania | 5,608 | 7 | 2,377 | 13 |
| other | 20,221 | 4 | 14,356 | 6 |
| utopian | 2,137 | 11 | 48,975 | 3 |
| zappl | 1,970 | 12 | 2,725 | 11 |
| steemkr | 1,417 | 14 | 14,719 | 5 |
| streemian | 5,000 | 9 | 4,373 | 10 |
| chainbb | 1,058 | 15 | 2,490 | 12 |
| bescouted | 800 | 16 | 684 | 15 |
| wp-steem | 1,731 | 13 | 112 | 17 |
| pysteem | 4,864 | 10 | 7,505 | 9 |
| dsound | 342 | 17 | 602 | 16 |
| steemjs | 33,193 | 3 | 823 | 14 |
| total | 619,028 | 1,295,965 |
Methodology and Tools for Analysis
Raw data was obtained through sql queries of the Comments table in steemsql (thank you as always @arcange!) using Valentina Studio.
Data was analysed in Numbers, the mac spreadsheet tool.
Data was obtained across all of 2017 for the first chart, and from 25 October to 24 November for the thirty day period.
Questions
If you have any questions or spot any errors please do not hesitate to leave a comment.
That's all for today. Thanks for reading!
Posted on Utopian.io - Rewarding Open Source Contributors
Such great data. I honestly thought Utopian was taking up to %10 before I saw this.
Well the above is over a thirty day period and Utopian payouts have really grown rapidly over that time. I think they're at around 8% by the end of the thirty days and could easily be hitting 10% if curators start to pile in!
D.Tube really needs to lifted much higher.
It is time that each of us put up a short video everyday.
The last update made loading videos a great deal easier.
I think that use of a lot of these applications will start to increase as people become more aware of them. I have to admit, I'd heard of lots of these but not even visited some of them.
Also when I looked over the thirty day period about 98% of people had only used one or two different apps, so there's huge scope for increase.
It depends on the platform as well. Utopian holds the largest scope for growth IMO because it specializes in what it does, and no STEEM platform does that as well as Utopian. And most Steemians are technologically literate and are concerned with things such as BTC, STEEM, and the blockchain.
Busy is one of the worst IMO because it is pretty much a copy of Steemit, and there is no reason why people should choose Busy over Steemit because they both serve the same function.
I think busy has some good points. I'll be writing about it at some point this week. I'll try and persuade you!
hey, great analysis! I did a similar thing with a different focus and a shorter time scale around a month ago. At that time I had the impression, that 3rd party apps gain market share relative to steemit. Seeing your data from that time until now it seems that the absolute 3rd part numbers increased, but the steemit numbers even grew faster, effectively reducing the relative 3rd party share. With "posts", you also looked into top level posts, no comments, right? I could imagine that (mobile) apps like esteem could have a slightly higher share for comments.
Ah very cool @crokkon, I hadn't seen that. We need some sort of database to keep track of all the different analyses!
Yes, I just looked at posts, not comments. It reduced the data requirements but also I think is probably a better measure of user buy-in as posts take much more effort (and also make up the bulk of post payouts).
I think that the 3rd party apps will definitely have gained market share in post payout over the last month: utopian in particular and busy have both taken off. Post numbers is more complex because of spam issues which particularly have inflated the steemit and steemjs numbers.
I love especially when presented in bar charts and pie charts. Good job.
Thank you @greenrun!
Another fantastic piece of analysis @miniature-tiger. @utopian-io is the perfect place for you :D
I've used 7 of the above in the past few months, and was not at all aware of the total!
Thanks Asher!
7 is a good effort. I'm at 4 so I've got a bit of catching up to do!
2 didn't really work so well :D
Thank you for the contribution. It has been approved.
You can contact us on Discord.
[utopian-moderator]
Thank you @flauwy! I was starting to get worried there!
Let me know if you need any more moderators to pick up the analysis work. It's something I've got a pretty good handle on.
Why did you get worried? A review can take up to 48 hours, you post is only 5 hours old.
There will be new rules announced for joining the MODs very soon.
Hey @miniature-tiger I am @utopian-io. I have just upvoted you at 9% Power!
Achievements
Community-Driven Witness!
I am the first and only Steem Community-Driven Witness. Participate on Discord. Lets GROW TOGETHER!
Up-vote this comment to grow my power and help Open Source contributions like this one. Want to chat? Join me on Discord https://discord.gg/Pc8HG9x