Utopian-io Bot v2.0 Analysis : Top 10 Contributors - Steemit Business Intelligence
This is an update on the voting performance of @utopian-io. This does not include the manually un-voted and up-voted posts just did today (i.e., some tutorials receiving 1.5% which was increased to 10%). See @utopian-io's steemd transactions for the details.
1. Scope of Analysis
Before diving into the details, we will first have a look from which application were the contributions coming from, then which categories had the most number of contributions, the average number of votes each category receives, the Github projects that benefited most from the contributions, and then lastly the top 20 contributors of these posts.
- Posts were acquired on Nov. 16, 2017 0657H UTC using steemsql by @arcange.
- There were a total of 229 posts contributed by 117 accounts.
- Contributions were spread across 69 repositories.
- Data extracted was from
2017-11-14 1500H UTCto2017-11-15 2158H UTC.
2. Posts By App

This time, only two applications were used to post contributions. 175 contributions (76%) were made through the utopian site, and the remaining 54 contributions (24%) were made through steemit.com.
Here are the data in table format:
| App | Post Count |
|---|---|
| utopian/1.0.0 | 175 |
| steemit/0.1 | 54 |
3. Contributions Per Category
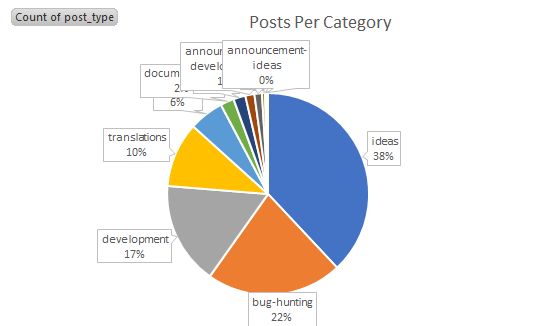 |  |
From the two images above, we can now see that contributions were distributed across 5 main categories - ideas (now labelled as Suggestions), tutorials, translations, development, and bug-hunting. With the ideas category still getting the larger part of the pie with 61 posts (27%).
Here are the data in table format:
| Category | Post Count |
|---|---|
| ideas | 61 |
| tutorials | 40 |
| translations | 35 |
| development | 32 |
| bug-hunting | 27 |
| graphics | 12 |
| video-tutorials | 9 |
| blog | 7 |
| copywriting | 2 |
| analysis | 2 |
| task-development | 1 |
| social | 1 |
4. Top 10 Github Projects
With the amount of these contributions, let's look at the Github projects that benefited most from these contributions.
Due to the large number of Github repositories (69 projects), I've trimmed it to the top 10.

Again, the top most contributed site was steemit.com (github repository steemit/condenser) with 52 contributions (34%). Followed by utopian-io with 37 contributions (24%). And third by busy.org with 13 contributions (9 %).
Here are the data in table format :
| App | Post Count |
|---|---|
| steemit/condenser | 52 |
| utopian-io/utopian.io | 37 |
| busyorg/busy | 13 |
| eSteemApp/esteem | 11 |
| WordPress/WordPress | 9 |
| null | 7 |
| utopian-io/api.utopian.io | 5 |
| techtek/steempi | 5 |
| steemit/steem | 5 |
| steemiz/steemiz | 4 |
| steemit/steemconnect | 4 |
5. Top Categories for Steemit.Com (aka steemit/condenser)
So what are the top categories of contributions to steemit/condenser? Let's look at the data.

In agreement with what we saw in section 3. Top Categories, we see that it's the ideas category.
6. Average Vote Count Per Category
How about the average number of votes per category?

We can see here that the task-development category has highest number of votes. But again, let's see how many posts were made.
Here's the data in table format:
| Category | Post Count | Ave. Vote Count |
|---|---|---|
| task-development | 1 | 434 |
| blog | 7 | 73.57142857 |
| development | 32 | 69.6875 |
| social | 1 | 50 |
| video-tutorials | 9 | 41.88888889 |
| tutorials | 40 | 41.875 |
| translations | 35 | 40.88571429 |
| analysis | 2 | 39.5 |
| graphics | 12 | 30.91666667 |
| ideas | 61 | 29.91803279 |
| bug-hunting | 27 | 27.92592593 |
| copywriting | 2 | 12 |
We can see that there was only 1 post for task-development which resulted to it having the highest average.
7. Top 9 Contributors (By Post Count)
As mentioned in the introduction, there were 117 accounts used to create the contributions. I wanted to make this to Top 10, however, due to the number of accounts sharing the same number of post count (21 accounts contributed 3 posts each), I trimmed it down to 9.

Let me reiterate that this is based on the post count, not the vote value that each post received. In the next section, let's see if this contribution count automatically translates to vote value received.
8. Top 10 Vote Receivers

We can see here that the top vote benefactor is @vladimir-simovic. Here is the data in table format:
| Account | Post Count | Total Payout |
|---|---|---|
| vladimir-simovic | 8 | 424.9801004 |
| elear | 4 | 329.1745547 |
| robin-ho | 15 | 320.8794325 |
| samrg472 | 3 | 305.2908724 |
| rosatravels | 5 | 279.1080861 |
| imwatsi | 3 | 214.1348504 |
| yandot | 3 | 205.1766241 |
| netuoso | 3 | 194.7948992 |
| sirrius | 2 | 170.8778858 |
| nehomar | 3 | 166.8816413 |
I am reiterating my stand on what @elear mentioned in this post.

I am part of a Steemit Business Intelligence community. We all post under the tag #bisteemit. If you have an analysis you would like carried out on Steemit data, please do contact me or any of the #bisteemit team and we will do our best to help you...
You can find #bisteemit on discord - https://discordapp.com/invite/JN7Yv7j
Posted on Utopian.io - Rewarding Open Source Contributors
Hey @eastmael I am @utopian-io. I have just upvoted you at 35% Power!
Achievements
Did you know?
Up-vote this comment to grow my power and help Open Source contributions like this one. Want to chat? Join me on Discord https://discord.gg/Pc8HG9x
Thank you future community-driven witness. :)
Hi,
for the sake of completeness, i just wanted to mention that we should keep an eye on gross and net earnings.
Your analysis shows the gross receipts. But the actual payouts are a little lower, as the commission for the Steem Power delegations still has to be settled.
Thank you. Will consider this on future analysis to consider both the 25% curation and 20% beneficiary rewards. Thank you for pointing this out.
Thank you for the contribution. It has been approved.
[utopian-moderator]
its nice bro