Statistical arbitrage trading in crypto markets (intro + strategy)
Hello everyone!
Welcome to what I hope becomes first article in a weekly column where we try and test different strategies that are used in traditional stock markets and try to come up with some of our own.
Inspired by this great article, it seems that the steemit community would like to read about statistical arbitrage trading and I'm excited to contribute my part.
But first things first, let me introduce myself.
About me
I hold a masters degree in Financial Mathematics. I did my masters thesis on statistical arbitrage strategies in the US stock market.
I worked in the data science field for 3 years before and after graduation at a analytics consultant company, focusing on applying machine learning to trading. Later on I switched to more general data science, but still mostly dealing with problems in the insurance and banking industry. Currently I am employed as a Data Scientist in charge of game economy and monetization at a top grossing mobile gaming company.
The tools
- R
- Python
Most of the work I do is in R because of the vast amount of statistical libraries available and loads of functionality I have written over the years is in R. Python is a strong second especially for data gathering (like scrapy) and some frameworks that are not available for R.
Introduction
In this article we will cover the basics so that for future articles readers can always go back to understand the terminology.
Statistical arbitrage strategy
The term statistical arbitrage strategy, as I use it, means any trading strategy that relies on historical statistical data to gain an edge, i.e. create a statistical arbitrage opportunity. The momentum strategy outlined in furions article is thus regarded as a statistical arbitrage strategy. The basis of any arbitrage strategy is its performance on historical data.
Roughly this translates into 3 steps:
- Strategy idea outline
- Here we outline what we want to achieve - momentum: stocks that rise in price will keep rising and vice versa
- Training phase - Parameter tuning on training data
- What do we define as a rising stock? Last year of trading, last week, last day? Do we re-balance monthly, daily, hourly? To see what performs the best we take a training set of data and check performance
- Testing phase - Testing on historical data
- Here we put the strategy to the test and see if it can outperform some arbitrary benchmark, usually a buy and hold strategy
Measuring performance
In most articles we will use the following measures of performance:
- Cumulative return
- The total return our strategy generated during the testing phase
- Average annual return
- The cumulative return expressed as an average annual return
- Volatility
- The strategy volatility is defined as a standard deviation of its returns and is a measure of risk associated with the strategy - we will usually look at volatility on an annual scale (as with return)
- Maximum drawdown
- The largest % drop from the maximum, i.e. what was the biggest loss the strategy suffered in testing
- Sharpe ratio
- A measure of return in excess of a risk free strategy per unit of risk - we will take risk free as 0% return (e.g., put the money in a bank account or sock), meaning we will define Sharpe ratio as annual_return/annual_volatility
Learn by example
In this first article we will try a simple risk minimizing strategy using simple moving average (SMA). SMA calculates the average of the last N prices (with a fixed sampling of the price) over a fixed time period.
Strategy outline
We will trade BTC/EUR and use daily prices. If the current price P is above SMA then we will hold a position in BTC. Vice versa, if the current price P is below the SMA, then we will hold a position in EUR.
Parameter tuning
We will try 7, 30, 180 and 365 days for the lookback period.
Data
Daily data is gathered via cryptocompare API. The whole dataset contains data from 2011-08-27 to 2017-07-02. We will train on 2 years of data from 2012-08-25 to 2014-08-25, where the data before is needed for our longest lookback period (365 days).
We will then test on almost 3 years of data from 2014-08-26 to today.
We will assume a starting balance of 10 000 EUR.
Results
Training period
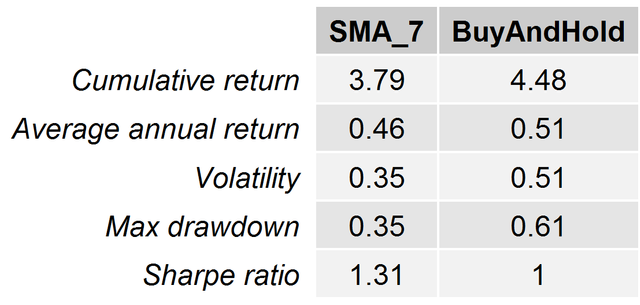
We can see from the statistics on the training set that the SMA strategy almost universally reduced risk no matter the lookback period. Namely it reduced volatility up to 45% and drawdown up to 19%. The narrower lookback period (7 and 30) performed best giving us a hint to perhaps look into even shorter time frames.
Regarding returns, the buy and hold performed better than most SMA strategies, but failed to outperform the 7 day SMA - much to my surprise. I was coming into this fairly certain that the buy and hold will reign supreme in returns due to knowing the its rising history and that we will only cut volatility.
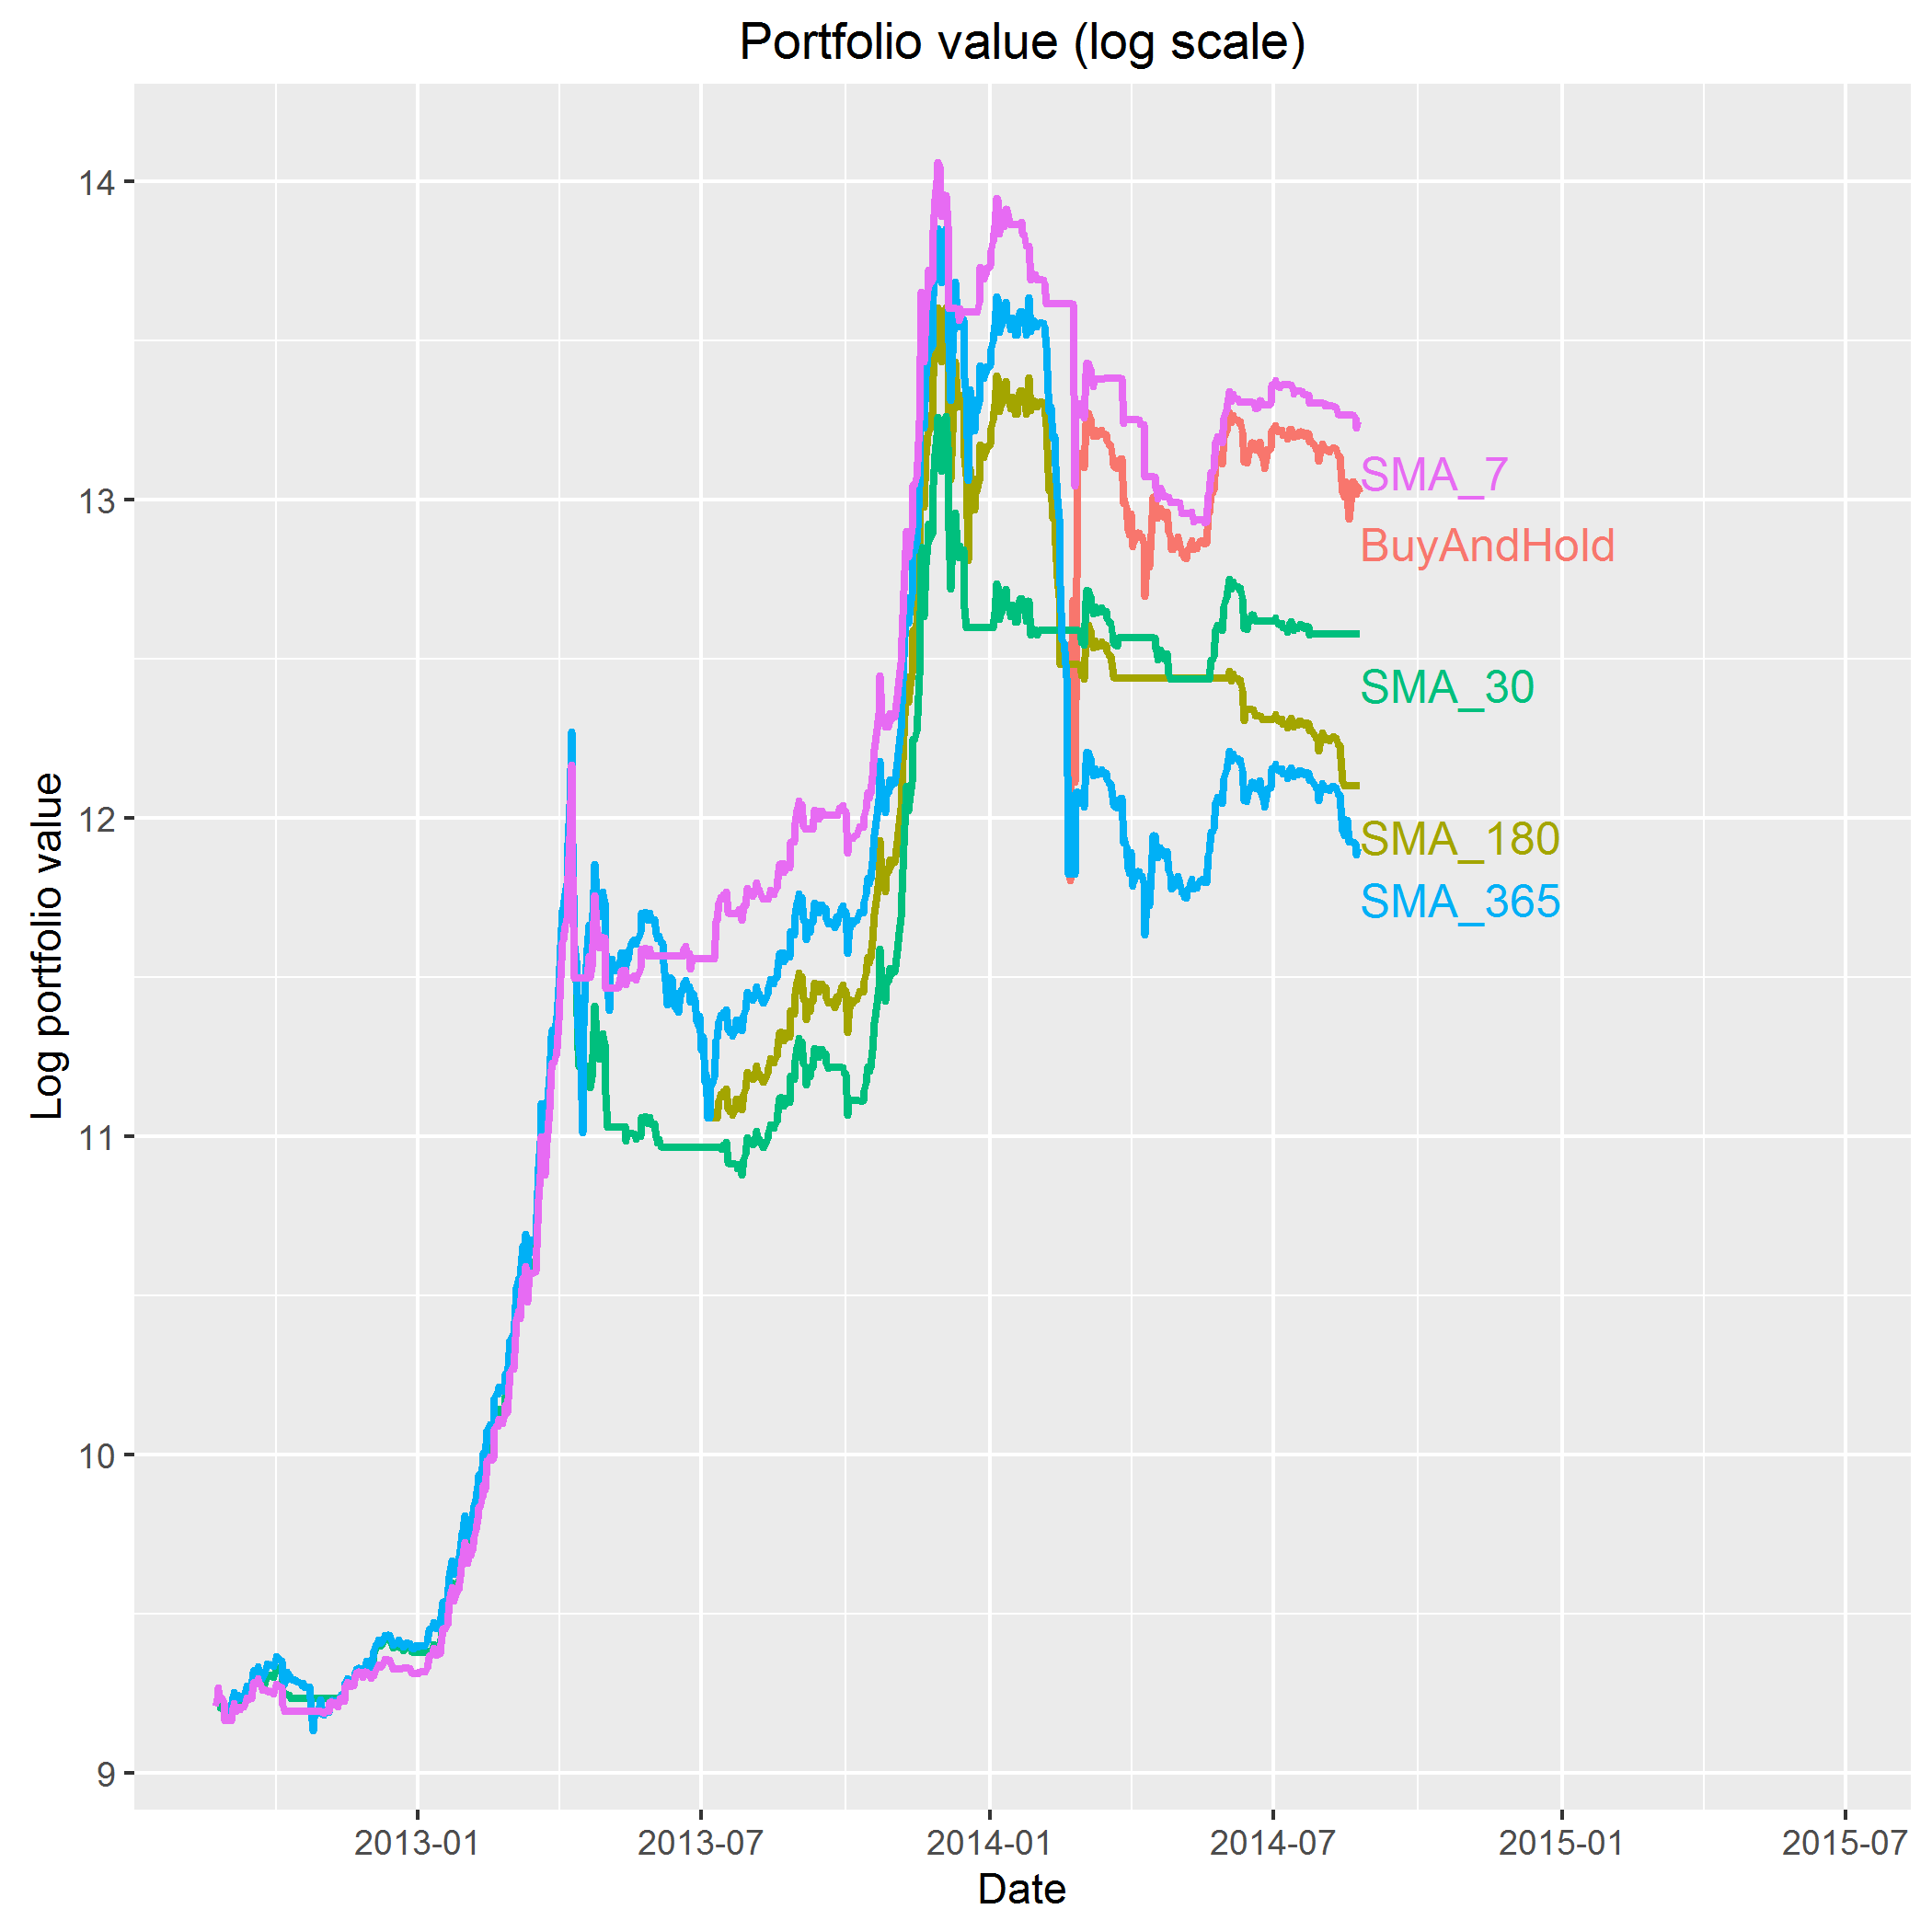
If we look at the log curve of the strategy portfolio value, we see that the 7 day and buy and hold are basically the same strategy until early 2014 when Mt Gox happened. The 7 day SMA cuts its losses while the Buy and Hold suffers through it.
All in all the 7 day SMA is a clear winner on the training period and it's time to put it to the test!
Testing period
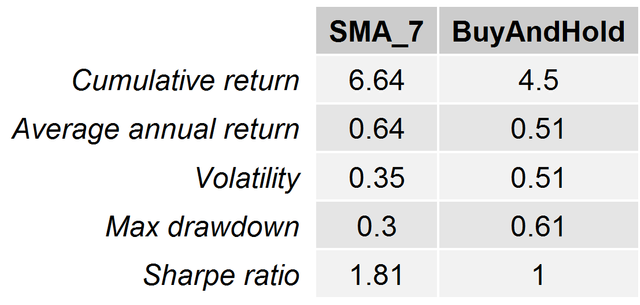
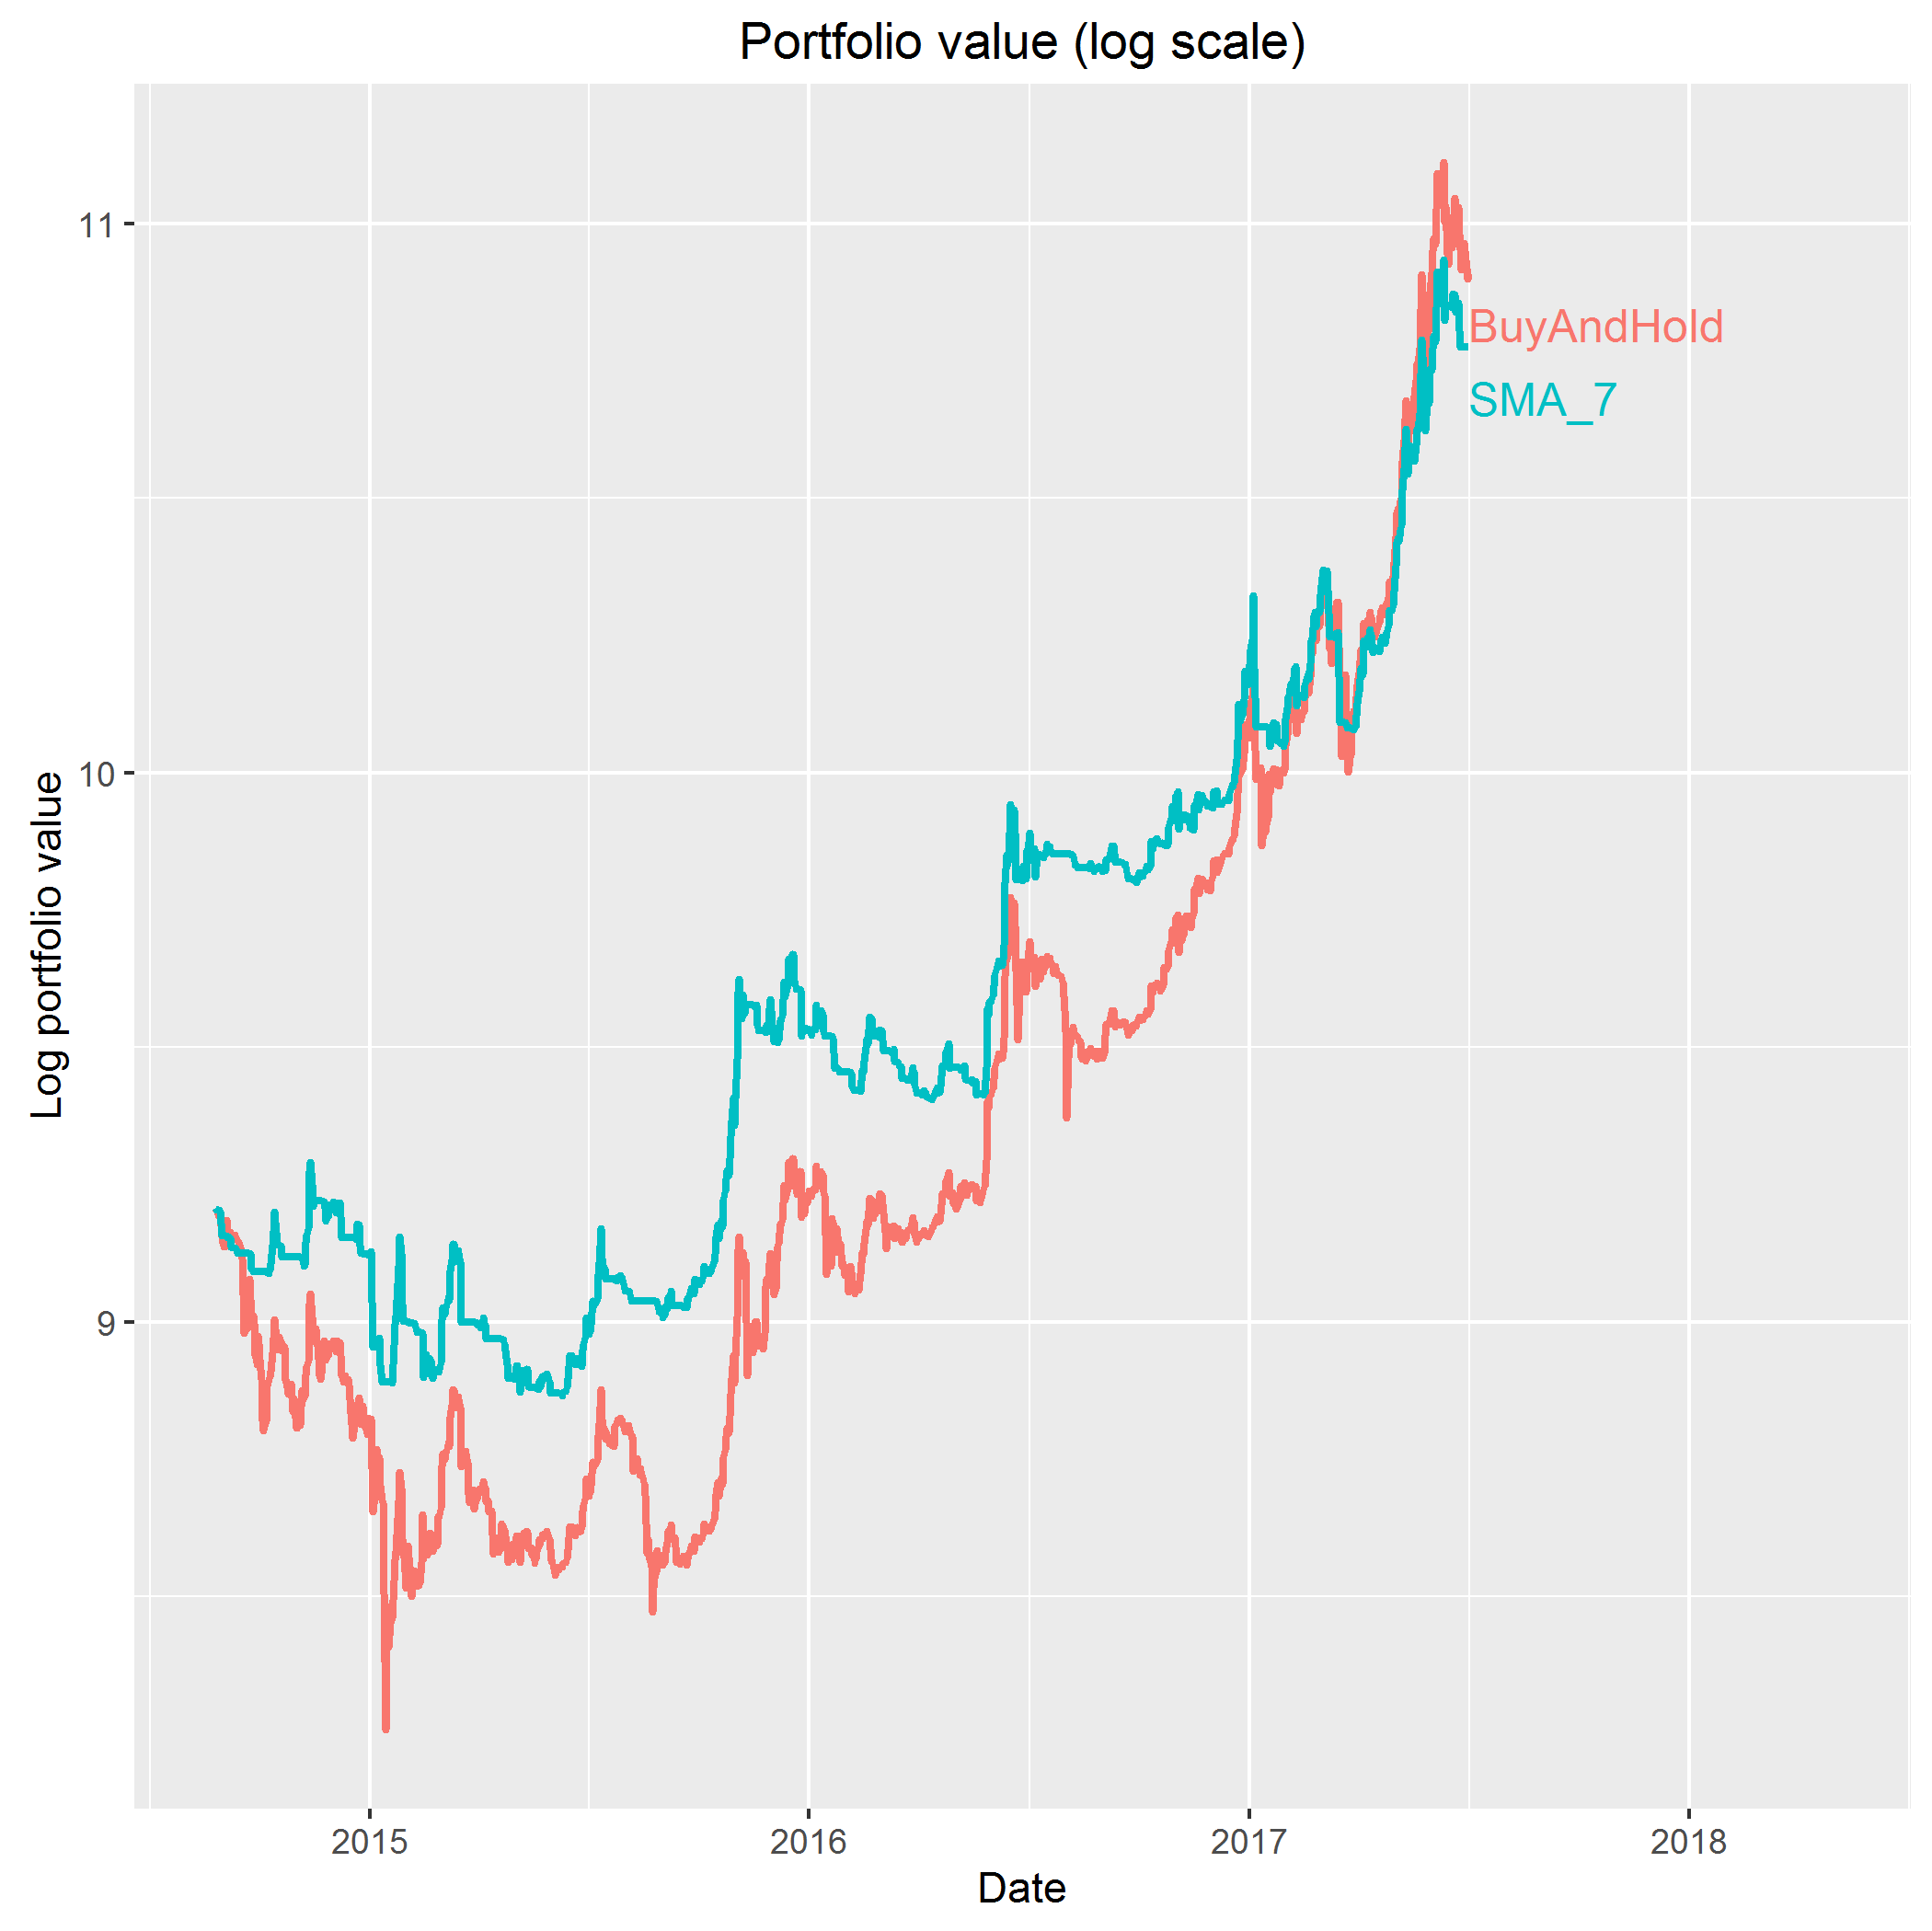
In the 3 years 2014-08-26 to today we can see that day 7 stays strong on all statistics, cutting max drawdown by half and volatilty by 30% while maintaining a higher cumulative return, earning 64% a year.
Conclusion
In this article we presented a quick intro to statistical arbitrage trading and a simple trading strategy that performed well.
In the next one we will try another strategy and overview of traps and pitfalls of statistical arbitrage trading that come in the form of biases that we have to be aware of when designing, testing and implementing a strategy. We avoided at least one bias in this article, but perhaps we missed some others. Can you name some that we avoided and some that we didn't in our SMA strategy?
Besides writing biases, I would welcome all discussion and feedback - both on my writing style, content or explanations you feel are lacking and other areas where I can improve. And if you have an idea that you deem might be worth testing, please let me know.
TRADING FEES UPDATE:
So I got a lot of questions about trading fees. I initally did not want to list trading fees as that is one of the biases I wanted the readers to question (which they did). Using Kraken 0.26% market trading fee (if you are a high volume trader this fee gets lower) we get the following results:

This means fees eat up 18% of our annualized return. This is due to a 7 day lookback period changing the signal more frequently than a longer lookback period would.


Write good
Arbitrage opportunity https://steemit.com/gifto/@fifelue/tips-be-a-millionaire-using-arbitrage
Great work. Where are you based?
Beautiful post
I wrote an article that explains a simple way to arbitrage across cryptocurrency exchanges, would love to hear your thoughts about it. It doesn't use statistical arbitrage, but rather just pure arbitrage across a single currency pair and two exchanges. https://steemit.com/arbitrage/@kesor/the-math-behind-cross-exchange-arbitrage-trading
Nice post! I will follow you from now on. +UP
https://steemit.com/statistical/@pavybez/long-short-statistical-arbitrage-on-20-cryptocurrencies
Congratulations @zsedo! You have received a personal award!
Click on the badge to view your Board of Honor.
Do not miss the last post from @steemitboard!
Participate in the SteemitBoard World Cup Contest!
Collect World Cup badges and win free SBD
Support the Gold Sponsors of the contest: @good-karma and @lukestokes
Congratulations @zsedo! You received a personal award!
You can view your badges on your Steem Board and compare to others on the Steem Ranking
Vote for @Steemitboard as a witness to get one more award and increased upvotes!