More Playing with BTC/USD Data - Quantitatively
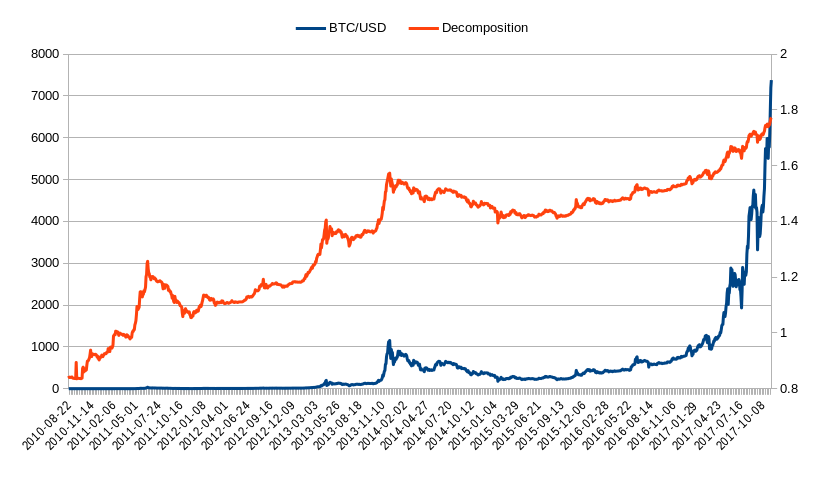
So I have been playing all day with BTC/USD historical data, I have here some quant papers recently came out, with some fresh observations and modeling suggestions so I have been testing the new model and methods on the BTC/USD data whether it is useful for forecasting or not.
That research is not completed yet, instead I have completed my research on auto-regressiveness of the BTC/USD price. I have also discovered better benchmarking tools that are unbiased.
Auto-Regressivity
So I have already discovered this week and last week that the BTC/USD is pretty much resembling a ARIMA(0,1,1) shape thus no AR element. Then you can also look at the PACF chart, and see that it spikes at lag 1 and then it's below significance. But it's either 0 or 1, it can be either.
So I wasn't satisfied with previous research's results and I investigated the phenomena directly instead of relying on stiff protocols, I did it myself.
And I did it in Python with my own scripts, unfortunately I still could not find my old scripts, it's probably in my old apartment that I have sold since then, since we moved into our house with my wife, I think it was on a hard-drive that I forgot to pack. Well anyway I remade the scripts, it was not that hard, but I was very precise not to make mistakes, so I checked the results and manually computed them in a spreadsheet so to make sure the models were correctly implemented.
Plus you might never know if the statistical software has any bugs, or you input the data in the wrong format, or you just have no clue how to use the software, and might get bogus results as a result. Statistical softwares are harder to use than the mathematical part itself. The math part is much easier to figure out, than how to use these complex, proprietary softwares.
So anyway, open source python scripts are the future, doubleplus I have the flexibility to modify the model if I want to and add certain checks and error calculation systems.
Better Benchmarking Tools
1) Natural Logarithm
Which brings me to my next point. Most statistical software use crappy concepts like Mean Error, Root Mean Square Error, and nonsense like that.
I find it really stupid that anyone would use concepts like that. They are very very biased. I am not just talking about biased as in the square root function is biased, I am talking about biased as in the digit system is messed up as I described it here:
So I use LN based errors. Just taking the fraction between the forecast and the actual price in a LN function and then taking the average of the LN outputs. It's provably unbiased since the LN function remains static even if the decimals grow, so it's a better relativistic function, plus in trading we are only interested in the fractional difference of the prices since the profit or the loss in a trade is fraction based. Plus we are talking about 5% profit or 2% loss and don't care about the numerical value of it, since it should scale with all capital sizes.
Doubleplus the LN function is additive, while normal fractions are not. So it's the best benchmarking tool that I know for error measurement.
2) Random Walk Benchmark
However what are we comparing that to? I first started comparing it to my other forecasts, but then I realized different models use different lags, so it's not entirely honest to compare forecasts to different lags or sliding data, since it's not the same dataset. Of course for some models must lag some steps, since it needs 1-2-3-4... lags to initialize itself. But even then it's still not the same data, so we can't compare them.
Then a brilliant thing came into my mind. We can just compare the average LN Error to the AR(0) output at the same lag level. So we use the random walk output as the benchmark.
So basically the initial hypothesis is that the price is a random walk, totally unpredictable, which is described by the AR(0) model without constant. Now we compute the LN error for this model at the same lag level. And then we just compute our own model say an ARIMA(1,1,5), so then we have the LN error of the AR(0) model aligned to LAG 5, and we have the LN error of the ARIMA(1,1,5).
- If the Model LN Error < Random Walk LN Error then the model gives us an edge, possibly a profitable forecasting model
- If the Model LN Error >= Random Walk LN Error then the model is rubbish and guaranteed to be non-profitable
It's that simple and this is provably non-biased as well. We can just take the difference between (LN Error-Random Walk LN Error) and if it's >0 then it's a good model.
So this is my guiding benchmark now to evaluate the quality of a model. Forget about Theil's U and other nonsense benchmarks, they may be biased or who knows.
This is a much better way to evaluate the quality of a model by comparing it to what the random walk would give. Since if the price is random, then obviously the best forecast is always the previous value, which doesn't tell use anything, so that would be a 0 edge. If it's worse than that then that is a negative edge, if it's better than a positive edge signaling profitability.
Progress So Far
Now I haven't found anything interesting yet. But at least I have discovered unbiased benchmarking tools that I will use to compare models between eachother.
I have discovered though that the BTC/USD market is not autoregressive. Now I know this for certain. I have both ran AR models in statistics software and I ran them in my Python scripts.
I have estimated the parameters roughly, since it takes a long time to calculate them with precision. What I have discovered in every case is that if I set the parameters to lower precision then the LN Error is always higher than the Random Walk LN Error with any AR based model.
But if I set the parameters to the highest precision I can compute, the LN Error becomes exactly equal to the Random Walk LN Error.
Thus the AR models, all of them are garbage when it comes to BTC/USD. Possibly on other markets as well, but on BTC/USD it's certain.
Now this can be explained easily. The market is efficient, sort of, so the previous price doesn't reveal anything about the future price.
So if you guys are playing around with Technical Analysis indicators, you are a bunch of losers, they provably don't work, exactly because of this reason.
Sources:
https://pixabay.com

I don't completely follow, but, what you're doing is interesting. It also tracks what I would have liked to have done if I were about 20 years younger.
Thanks, it;s not that complicated once you get used to it. In this article I just described that I have updated my benchmarking system. Many statisticians compare different forecasts together which is like comparing apples to oranges, in my my method I compare a model to it's random self, which is self -contained and it's provably unbiased. If the model is better then it's random self then, its obviously good, hinting towards an edge, possibly a profitable forecasting model.
Congratulations @profitgenerator! You have completed some achievement on Steemit and have been rewarded with new badge(s) :
Click on any badge to view your own Board of Honor on SteemitBoard.
For more information about SteemitBoard, click here
If you no longer want to receive notifications, reply to this comment with the word
STOP