Bitcoin Technical Analysis - 9/11/2017
Bitcoin has been trading down to sideways for the past few days. I've drawn two boxes to show multiple support and resistance ranges. The smaller box represents the current range that we are in. In the 6 hour chart, we had an upper resistance of $4716 and the lower support of $4141 . This represents the first range.
The secondary range is identified by the bigger rectangle. The high of $4965 and a low of $4000 serves as secondary resistance and support. If we the breach the inner range, then the outer box range will be in affect.
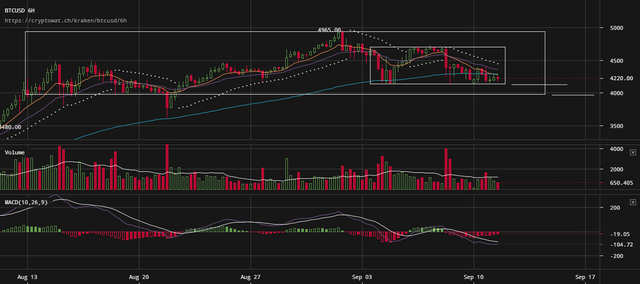
I think as long as we continue to trade sideways without breaking $4141 to the downside, we are poised to resume an upward price movement. Also, the two most recent volume areas correspond to the $4141 price point. Buyers have shown they are willing to purchase at this area with heavy conviction.
If Bitcoin gets back to within a $20 - $30 of $4141, that will serve as a good buy signal. Also, I'd put a sell stop below $4100 as downside protection.
Don't forget to Upvote | Resteem | Follow
Thanks @pairmike

Hi @pairmike , Do you consider volume in your decision making in any way ?
Yes, sometimes as a secondary confirmation to a support or resistance point. Volume should confirm a breakout, if it is strong.
👍👍
Good article man, encouraging to see actual technical analysis that is encouraging to BTC and the Cryptocurrency market in general!
Thank you for your kind words. I try to provide analysis to help people trade Bitcoin.
Thank you for the TA.
You are welcome. I'm glad you find these reports valuable.
I earned 5 bitcoins for one month with EthBitMiner, earn bitcoins today with Best Miner http://gmy.su/:xRYk
<img src=" "
"
I'll have to check it out. Thanks!
Unsolicited advertising could get you flagged.
Your Reputation Could be a Tasty Snack with the Wrong Comment!