RE: BTC almost $4,000!!! Will it hit $6,000 or more? Where do I take profits on my Free coins?
Hi Everyone!!!
This is the 3rd time I am posting this question. Really sorry for this.. I originally asked this from Luc. but he seems a lot busy so anyone is welcome to answer. And please do :-D
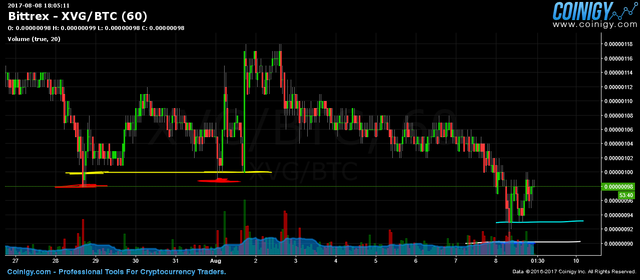
I marked a base for XVG and guess what proving Luc is always correct it cracked the base on 9th August and bounced back.
I wasn't aware of this because I almost forgot to check and I marked that base on 2nd August at 11.25P.M GMT+5.30
It did bounce back but I have a doubt, Did I identify the base correctly? I don't take the very bottom of a dip I take sightly up before that where the price touched 2 or more times.
I also check for the same base in the past to see how many bumps it had.
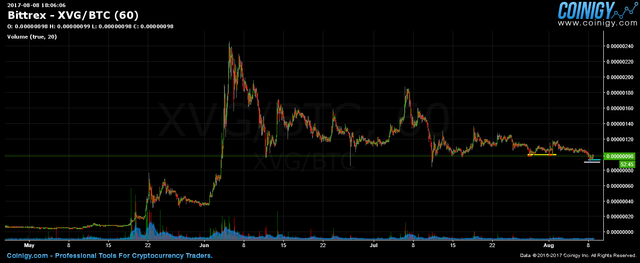
Yellow is the base I drew and red is the lowest price of that dip.
Since now it bounced back up which point I should consider as the new base ?
White line (0.000000090) or Light blue line (0.00000093) ?

https://www.coinigy.com/s/i/5989fd5834334/

https://www.coinigy.com/s/i/5989fd8eaf75d/
Thanks everyone and I really hope someone will help me this time :-)
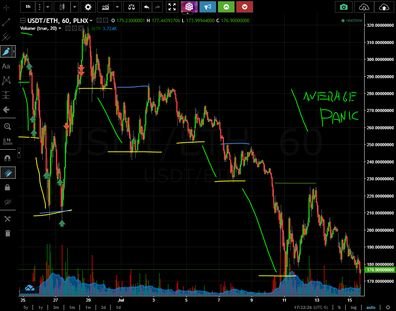
Nipuna, I drew out this pattern, Luc's pattern, to follow and I don't see it anywhere in these charts. There is no panic drop. You might consider looking at some other charts.

Someone could please draw a base for me in this chart to explain? So I can see clearly and that's a great help also. I highly appriciate that..
You measure a power of base by looking how big its a bounce from this point/base. If its huge almost straight green bounce it's a base. If the chart bounce a few small ones from line of this base, its weakening this base.
This is Luc's explanation.

Where did Luc say that bouncing multiple times on a base (or multiple small ones) weakens the base? I thought bouncing multiple times on a base meant that the base was getting stronger?
In one of videos Luc mentioned something like that. I am paraphrasing. "Here was a base, but chart had here a few little bounces(before crosing base) so it isnt so strong now."
@quickfingersluc correct me please if I'm wrong.
Late response - but this is when it helps to understand the reason 'why' Lucs method works, beyond just looking at the chart patterns.
The reason we are looking for cracks of the base, is because the buyers who supported that price are completely caught by surprise.
Keyword here being surprise.
Because of this surprise, those previous buyers now turn into panicking sellers, and dump their positions at unreasonable prices. These unreasonable prices then get bought up by the big guys (who we try and buy alongside with) who then drive the price back up to the cracked base.
The problem with price consolidation off a base - people begin to start expecting a big breakout or drop. Doesn't matter which direction - what does matter is people are expecting something soon.
So with consolidation, there's not nearly as much surprise.
If it's a good chart, you should still get a bounce, but it'll be weak and may not fully return to the base.
This is also why buying "slow grinds" don't really adhere to Lucs method either.
Even if a slow grind 'cracks' a base, nobody will be surprised by it.
The greater the market is surprised, the bigger the overreaction (and panic) will be, which both makes the trade safer and more profitable.
@newrealms What do You mean, when You say "argument"?
@fulloflife, if you look at one of Luc's original videos he discusses the argument. It means there are a lot of people involved in trading a particular coin, there are a lot of buyers and a lot of sellers. The argument is what the price to buy at or sell at should be. There is a lot of activity and good volume. Hope this helps.
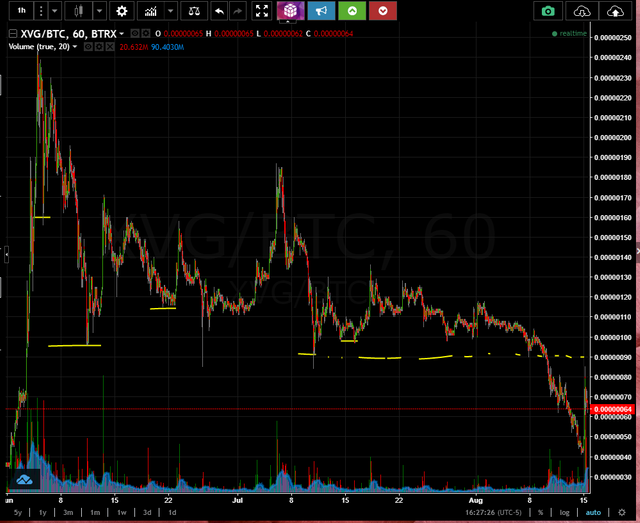
None of them. I'm afraid they are not bases at all. Look on previous bounces and %s and then you will see they don't qualify for being a bases.
Luc made his method very clear and I thought I understood that but what did I miss? How this much of a simple method became so complex for me ? :-( When I am watching Luc's videos and when he looks at a chart, I draw the bases in my head before he does and most of the time Luc also marks the same bases as I do. I am so confused now :-(
I dont know how you can find fault with this chart..
After a serious sell off and panic from 09s all the way down to 04s.. (that was an insane painful panic) it gives you a huge monster bounce back to 085ish.. That is screaming "i respect my bases!!!" ... like no matter how hard you push down XVG, it just gives you that monster bounce.. beautiful
Thank you man Thank you very much.. For your valuable time and all.. I am studying your chart very well now..
Even now I just found my biggest mistake (I hope)..
I am so stupid that I zoomed in the chart and marked the bases, with your chart I see how much of a fool I am...
Next time I'll zoom out as much as I can and mark the bases. You are always right.. These are so obvious bases that I missed. The reason was I thought those bigger bases won't brake again so I zoomed in and found little ones and thought they are the bases.. How fool I am :-D
Now I see clearly..
Next time expect me with a good marked chart :-)
Thanks to you I think now I have a clear mind..
Thank you again marking the chart for me that was what I really wanted, I can't thank you enough..
Thank you all others who replied me also.. upvoted all