Crypto Charts Analysis #9 Update : Bitcoin - Ripple - Monero : 16th July 2017
Hi fellow Steemians, fellow investors, traders and crypto enthusiasts. What a week. It's had downs and then some more downs but nothing that really was not expected. We will look at an update on the Bitcoin /USD charts and only talk briefly about Ripple and Monero.
There is a lot of fear with the upcoming Bitcoin fork. Due to this uncertainty of what is to come (SegWit) Bitcoin has taken quite a hit, however, this was not unexpected seeing the huge head and shoulders pattern that popped up on the chart. You can see the full chart analysis for the head and shoulders pattern here: Head and shoulders pattern on BTC/USD daily chart.
Apart from the Bitcoin chart pattern, there were also the two bullish patterns on Ripple (XRP) and Monero (XMR) we were following. I would still keep an eye on these, however, there is a high probability that before the big Bitcoin news comes out that we will not see any other movement other than that following the move of Bitcoin. This is due to the current massive bearish correction in Bitcoin. Due to these being cryptos, and are traded highly against Bitcoin, it is expected that they will follow the same trend. Nothing to fear since these trend lines will be very good levels to look at once the trend turns. If you are interested in seeing the initial analysis of these cryptos you can find them below. Remember the patterns on these charts are not a text book pattern anymore. I would have expected a move upward much earlier. For this reason, I will not be covering them in this update. Once a bottom has been hit there will be another update for these.
Bullish pennant on USD/XRP daily chart.
Triangle on the XRM/USD daily chart.
Cue the lights on Bitcoin.
Bitcoin/US Dollar (BTC/USD) - Daily Chart - Head and Shoulders Pattern
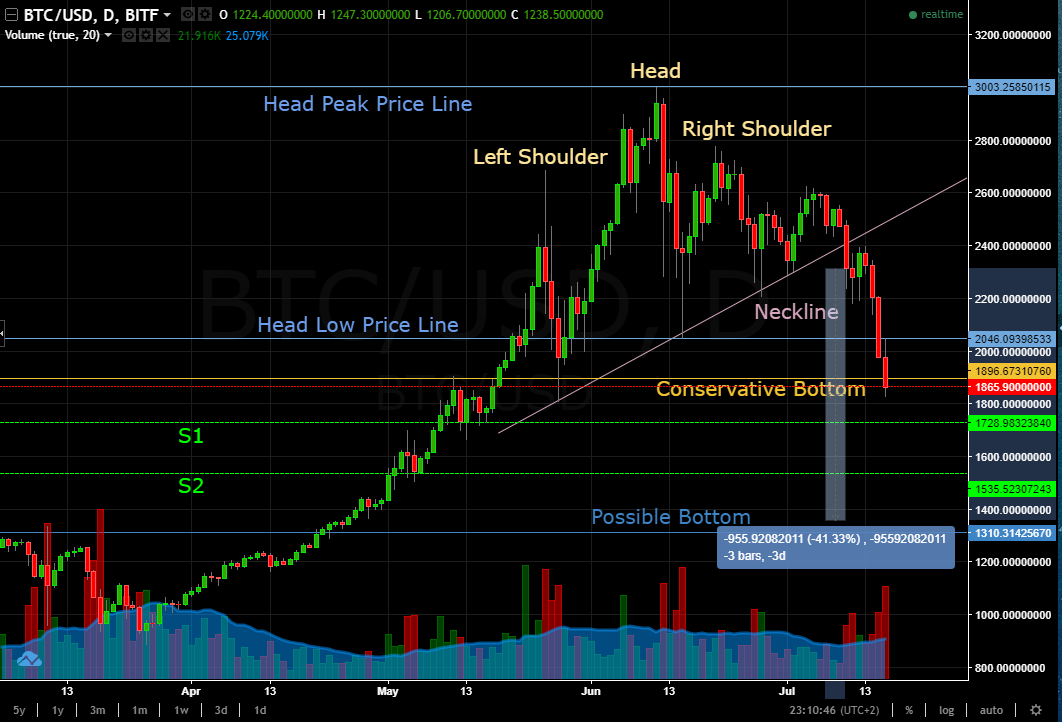
All I can say so far is that that move is pretty impressive and the momentum looks strong. Price just broke through the "Head Low Price Line" and momentarily retested the support (now turned resistance) before pushing down even further and breaking through that "Conservative Bottom" support.
From the initial analysis I have added two more support levels marked as S1 and S2 (both green dashed lines). These two levels are where I would expect the price to stall a little. If the price breaks through S2 then I would be waiting for the "Possible Bottom" support to be hit but I would not be expecting it to move down much more.
As you can see I have also included a measurement (marked as a light blue long rectangle) I have basically checked the "Possible bottom" support and have found it to possibly be some $50 dollars off. This new level is calculated from the close of the candle stick that broke the neckline to a depth equal to the distance between the "Head Peak Price Line" and the "Head Low Price Line". Though the difference is not much, only about $50.
As usual, keep watching the price action to have a better chance of catching the bottom safely.
So fellow Steemians, investors, traders and crypto enthusiasts what is your take on where the price of the price of Bitcoin is going? Do you agree or disagree with this analysis or do you have your take on what the chart is showing ?
If you want to check out my other blog posts check me out @nimda and don't forget to follow me.
If you like my content you can upvote and resteem, it helps a lot, and don't forget to leave your comments :)
If this post has helped you, you think this post is undervalued or you are just a really nice person and would like to tip me for my efforts you may use the following addresses.
Aragon - 0xaCfa6194DB1706C72abe6040999c443f66D3Eb45
Augur - 0xaCfa6194DB1706C72abe6040999c443f66D3Eb45
Bitcoin - 16UWGsAPvKa7uNygfG2ye5zbTLHMFGxtv7
Dash - XoCHHjYdAgncb8rYmjPkUNBk1c3mNmhtno
Decred - Dsb4fUJucjgtgZxtm32JMw51PorwPCqLtgA
Doge - DEij5s4F9qscFvAFHP475ESTDKYJ5wJ9xw
EOS - 0xaCfa6194DB1706C72abe6040999c443f66D3Eb45
Ethereum - 0xaCfa6194DB1706C72abe6040999c443f66D3Eb45
Golem - 0xaCfa6194DB1706C72abe6040999c443f66D3Eb45
Litecoin - LS6nZik7SQFtpqEnenY7HcMr8558mgFNj3
Reddcoin - RbHvv3Cjq1rJ8wBL8EmYAJ7a2WRWnZ7vDi
Thank you.
Resources
Coinigy - Online chart tools for Cryptocurrencies - Affiliate link
Coin Market Cap - Excellent resource with a loads of crypto data
Please keep in mind: The risk of loss in trading can be substantial. I am not offering financial advice nor am I telling you how or what you should be trading. I will simply be applying charting techniques I have learnt over the years. If, of your own free will, you decide to trade never trade with money you cannot afford to lose and if you do trade, try to spread out your trades on multiple assets. A diverse portfolio is much better than only holding a single asset.
You've been UpVoted via the UpVote Experiment 002 Bot. Depending on my VP & the price of STEEM you should get a $.01-$.03 for your trouble.
Read more about this experiment here.
Thank You - @blueorgy