Crypto Charts Analysis #8 Update : Bitcoin - Ripple - Monero : 12th July 2017
Hi fellow Steemians, fellow investors, traders and crypto enthusiasts. Wow, quite the last couple of days. Having seen the market correct over the last couple of days I was quite surprised to open the charts and see such strong bullish candlesticks. But is the correction really over like quite a few believe. I have my doubts on that.
Over the last week we have been following three cryptos against the US Dollar.
Head and shoulders pattern on BTC/USD daily chart.
Bullish pennant on USD/XRP daily chart.
Triangle on the XRM/USD daily chart .
So let us take a look at how the market changed over the last 24 hours.
Bitcoin/US Dollar (BTC/USD) - Daily Chart - Head and Shoulders Pattern
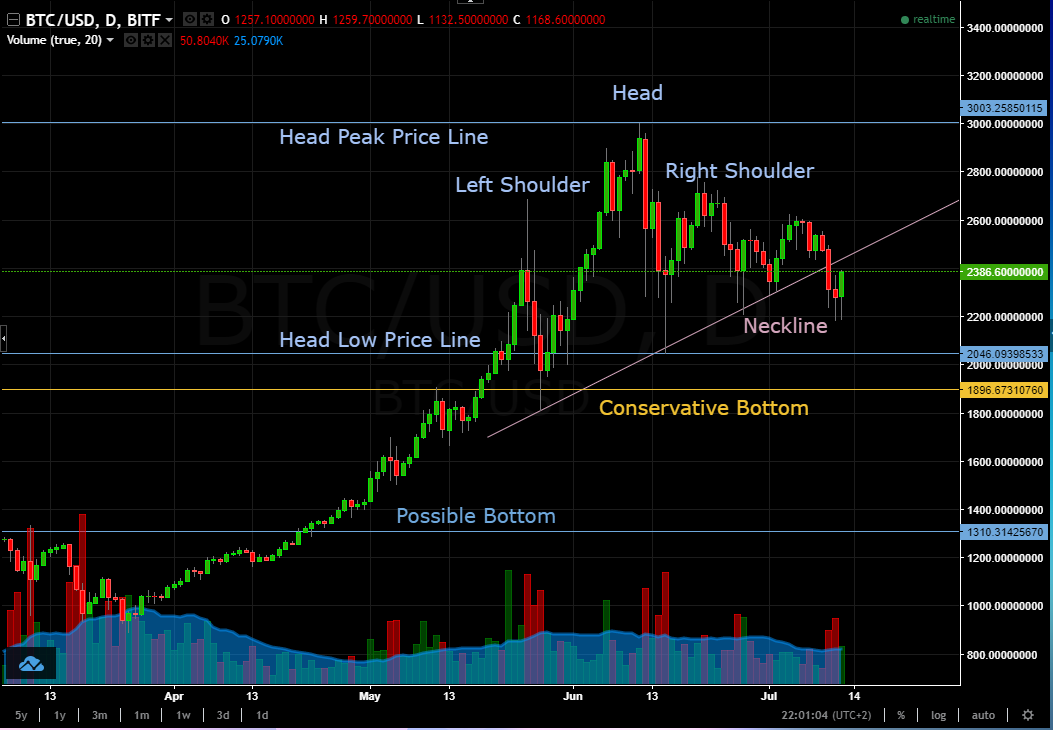
Bitcoin has had an interesting day. Is the current bullish move simply moving towards a retest of the neckline? There are three lower highs and now we have broken the previous two lower lows but we still have not broken the "Head Low Price Line" yet. I will sit on the sidelines for now and see what happens.
US Dollar/Ripple (USD/XRP) - Daily Chart - Bullish Pennant
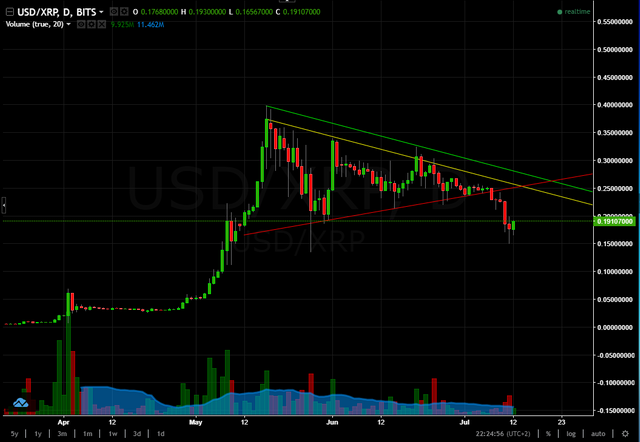
Ripple has had a similar pullback but not as aggressive as what we have seen with Bitcoin. Has it reached the bottom of its correction? Again we will have to see. However, if it does break the 0.15 mark and close below it I would start looking at possibly the 0.06 range for the next target. Has the bullish pennant failed yet? Not just yet. I prefer to wait a couple of days before making such a statement.
Monero/US Dollar (XMR/USD) - Daily Chart - Triangle
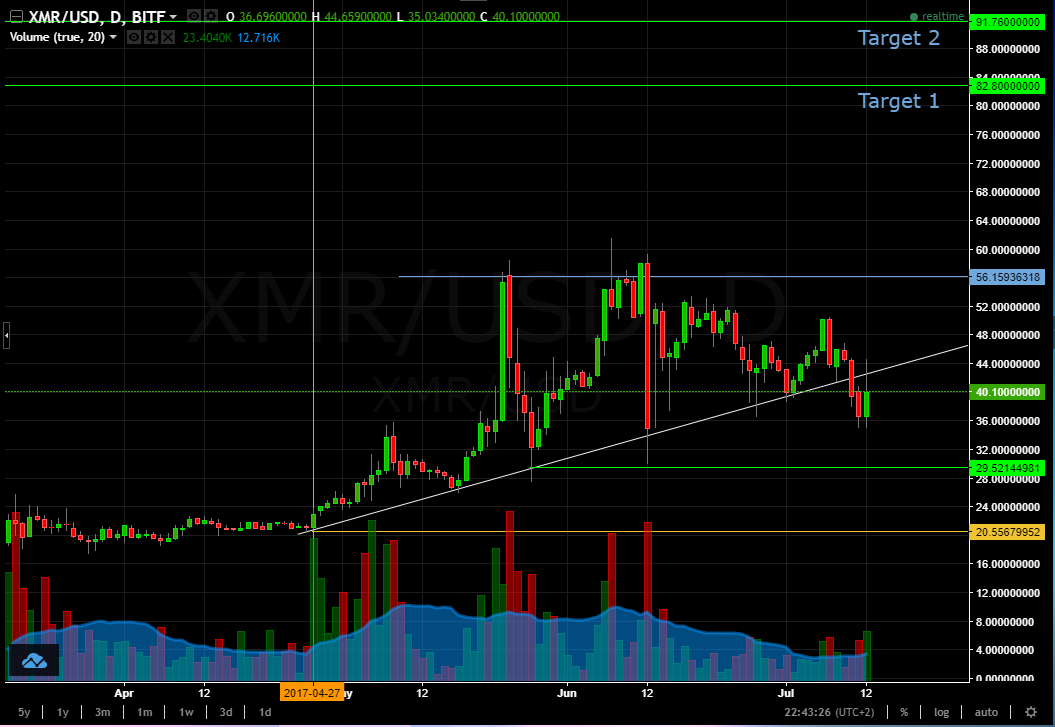
It's been a few days since we updated Monero. As soon as we saw the last bounce off the rising trend line, just 2 days later the price smashed through it, only to retest it again today. Seeing all the bearish moves on the charts I will wait for a bounce off one of the lower resistance lines, or if the price moves above the trend line I will wait for a breakout from the horizontal top of the triangle formation.
General overall thoughts
Seeing from the massive push in the price of cryptos it seems only logical that prices see a rather large correction. I am not looking to jump into any hype. Hype can go either way. You could either be very lucky or just plain unlucky and to be honest, I don't want to be either. I am looking for a clear entry point that will hopefully give me the safest and most sensible entry. Chart Patterns are a great way to see possible future price movement as is confirmation through price action.
You can look at any chart at the moment and see some interesting patterns. Are you following any other cryptos with interesting moves? Let me know in the comments.
So fellow Steemians, investors, traders and crypto enthusiasts what is your take on where the price of these cryptos is going? Do you agree or disagree with this analysis or do you have your take on what the chart is showing ?
If you want to check out my other blog posts check me out @nimda and don't forget to follow me.
If you like my content you can upvote and resteem, it helps a lot, and don't forget to leave your comments :)
Thank you.
Resources
Coinigy - Online chart tools for Cryptocurrencies - Affiliate link
Coin Market Cap - Excellent resource with a loads of crypto data
Please keep in mind: The risk of loss in trading can be substantial. I am not offering financial advice nor am I telling you how or what you should be trading. I will simply be applying charting techniques I have learnt over the years. If, of your own free will, you decide to trade never trade with money you cannot afford to lose and if you do trade, try to spread out your trades on multiple assets. A diverse portfolio is much better than only holding a single asset.