Trading Essentials Series: The Art of Reading Candlesticks

Learning how to trade is basically learning to listen what the market is telling you about the behavior of its participants. There are many tools and indicators designed for trading but still by far the best and the most important skill for trader is still being able to understand what is happening in the market by one quick glance.
Reading charts is thus an indispensable skill for any successful trading. Of all charts by far the most informative graphical representation are candlesticks.
So in this series I will explain the basics of candlesticks as well as some of the most important individual candlestick symbols and formations that can really help you understand what is going on in the market and use this knowledge to your benefit.
What are candlesticks?
Candlesticks are surprisingly old way of graphically representing the most important trading events in a certain unit of time. They were likely developed in the 18th century for trading on rice markets of the feudal Japan.
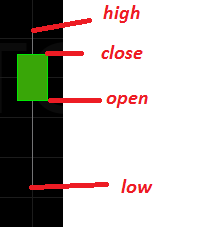
- Individual candlestick maps four pieces of price data in a unit of time it marks; opening price on the beginning of the time period, highest price within the period, lowest price within the period, and closing price at the end of the period.
- The space between the opening and closing price is refereed to as the body of the candle.
- The spaces between opening/closing price and highest/lowest price of the period are called wicks of shadows.

- The green candles are bull candles which represent a time period in which an asset gained in value.
Bull candle - The red candles are bear candles in which an asset devalued.
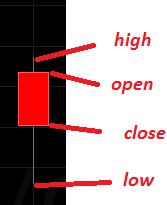
Bear candle - Candles without or with very little body are called dojis.
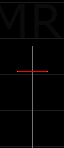
Doji candle
What can individual candlestick tell us?
Candlesticks give us important insight in trader behavior in a certain period of time. For instance:
- Long-bodied green candle shows a period characterized by enthusiastic buying, or whale pump.
- Long red body represents a massive sellout, whale dump, or panic sell.
- Doji candles (no body candles) represent indecisiveness or reversal of market trends.
- Long wicks always signalize strong antagonistic impulses between buyers (bulls) and sellers (bears). The direction of the wick can tell us where the price might move in the next period. On the top reversals (ending of price growth periods) you can often see long upper wicks. And on the bottom reversals of course the other way around.
- Candlesticks with no wicks signal determined trading action.
What are candlestick patterns and why are they important?
- Since individual candlesticks give us information about the trader behavior within the period of time, patterns (or formations) are an extremely important insight in market sentiment developments over time. The amount of information we can derive from a candlestick formation grows exponentially as opposed to single candle and forms a sort of narrative about how a certain sentiment appeared among traders, grew in momentum, then worn out and finally disappeared in market reversal.
- Knowing even several of the most important patterns can really make all the difference in your understanding of the market. Candle formations often form the fastest and the strongest buy and sell signals of all indicators.
What else is important for reading the patterns properly?
- The importance of time scale can never be underestimated. As a rule candles representing longer periods are always more reliable because they consist of more data.
- You must always be clear on your intentions when analyzing data - if you plan to hold on to the asset for months you shouldn't be relying on five minute chart.
- Actually there's almost no trading situation in which you should be relying solely on five minute chart and expecting to derive some profound understanding of market trends. Even for very fast trades I always view several time scales.
- When using candlesticks preferably always wait for the pattern to be confirmed in the following periods (candlesticks).
- Keep in mind that up and down are not the only two directions of the market, it can also move sideways in a period of indecisiveness. So reversal of the sellout does not necessarily imply a price rally, it can be beginning of indecisive period after which the price will keep falling.
- Trading volume is an extremely important piece of information. Bigger volume means more data and stronger trading sentiments. I always prefer trading high volume coins. This might be debated by some but my opinion is next: For an investor shitcoin might be coin with bad or inactive developers, or bad bussines model, or crappy community of users etc. But for a trader shitcoin is a coin with low trading volume. Investor in me tells me - Ripple is a major shitcoin. But the trader in me tells me - Hey, there's a great coin!
Some Important Candlestick Signals
There is huge number of distinctive candlestick patterns that have been described and named but knowing how to recognize many of them is much less useful than understanding how to read the story behind either individual candle or a pattern. That is why I will only explain few strong signals that will hopefully help you begin understanding the narrative of the candles. Even if you learn just those few signals with understanding you'll realize you are watching charts with completely new insight of what's going on. So let's continue:
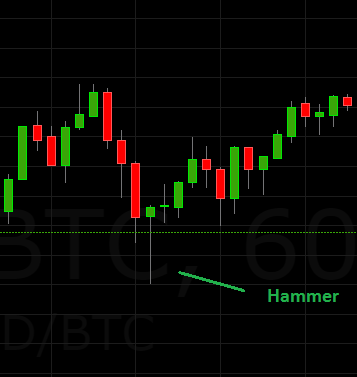
A hammer pattern marks the end of sellout.
- The Hammer is a candlestick with relatively small body and a long wick under it, at least twice as long as the body. Hammer always comes at the end of sellout period and serves as a strong signal for the end of bear dominance. If it's in other position it will be named differently; for instance on top of a rally it's called Hanging man and is also a solid reversal signal.
What hammer tells us about market is that the sellers are worn out and even though they tried to push the price far down to the end of the wick, the bull market is taking over, pushing the price close to the opening price. As with most other candlesticks, before acting on hammer you should always wait for the confirmation of new trend by candlesticks that follow.
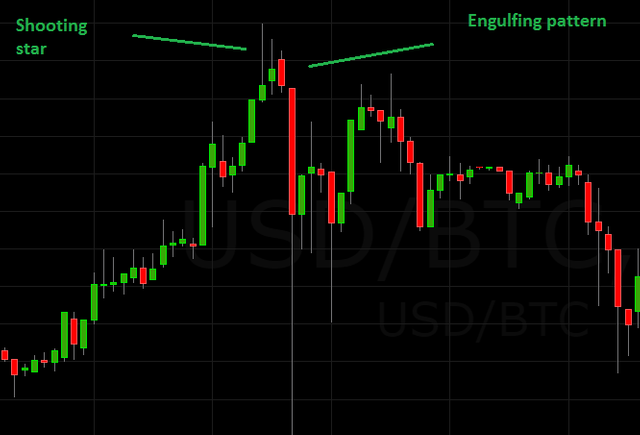
A shooting star and right after it another important reversal sign, the engulfing pattern.
- The Shooting Star is a complete opposite to hammer, with relatively small body and wick over it at least twice as long as the body itself. It comes on top of growth period and signals the end of bull dominance and the beginning of the sellout. The story it tells is a sad tale of bulls running out of their power and bears beginning their rule. If it comes on bottom of a bear run it is just a bit weaker reversal signal called Inverted hammer. You'll often see both of those.
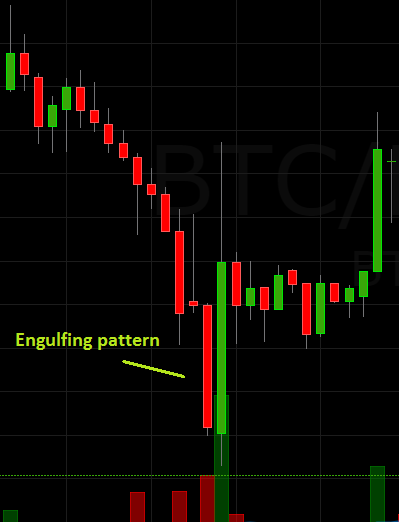
An engulfing pattern marks a strong and fast change in market sentiment:
- The Engulfing Pattern is another very strong reversal pattern that can signal both sellouts and price rallies depending on their position. It consists of two candles in which the following one is the other color and it completely engulfs the body of the previous.
It tells a clear story - imagine a strong sellout lasting for some time. After series of red candles the next period after last candle opens even lower. But then, instead of sinking further down the price suddenly recovers and by the end of the period it shoots over the opening price of the previous one, thus sending a strong signal that trader sentiment have changed and in this case bears are on the run.
If you see it be prepared and of course wait for the confirmation of the pattern and keep an eye on trading volume, more volume indicates a stronger signal.
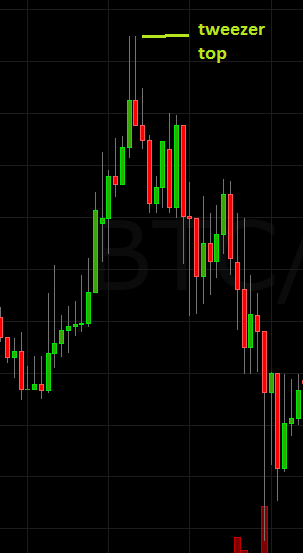
Tweezers on a tower top, time to think about selling.
- The Tweezers are both bottom or top reversal patterns which consist of two candlesticks with matching lows (in bottom reversal) or matching tops (in top reversals). It is a strong signal when coming after a strong trend.
The reason is simple; it often indicates market has found its strong support or resistance and will begin moving in the other direction. Tweezers are especially indicative when combined with the next pattern (tower tops/bottoms).
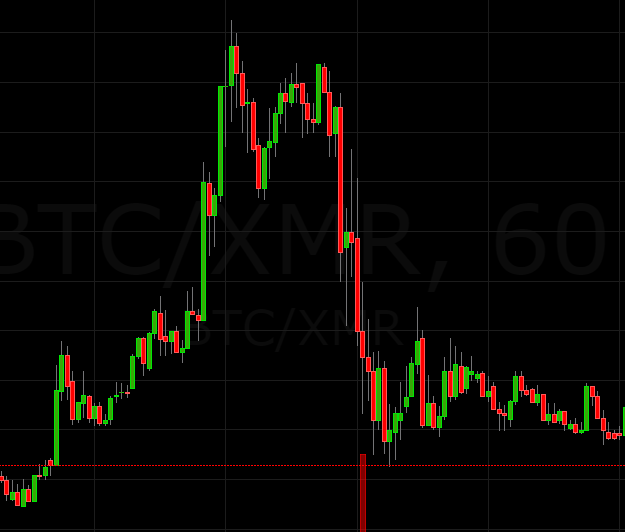
A classic tower top.
- The Tower Tops/Bottoms are very often seen in cryptocurrency markets because of pump and dump schemes.
The message is that long green or red candlestick indicates strong buying or selling tendency and is likely to be followed soon by a long opposite candle, making those tower top or deep narrow hole (tower bottom) appearance on the chart.
After one or more long candles of one color often you'll see market go in the opposite direction just after few smaller candles signal indecisive trading. The reason for that is that as soon as the strong irrational or manipulative movement wears down the reason jumps in once again and traders try to cash in before price falls or, in the case of tower bottom, to buy "on the dip". That is why tweezers (just like in the image) are very useful in signaling us that the irrational buying/selling has come to its end.
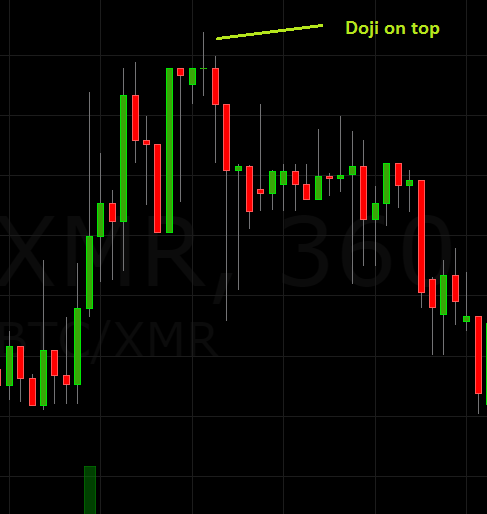
Doji does it's thing starting a strong sellout.
- The Doji patterns; several posts of this size can easily be written on the subject of dojis by themself, but I'll try to keep it simple and help you explain their significance in very short.
There are different types of dojis and to complicate things more dojis can be part of other patterns often making their signaling stronger. They are as I mentioned before very important signal of market turbulence, especially when they appear on the market with strong trading volume. Dojis coming after a period of strong and clear buying or selling tendency indicates traders have lost their determination and the change is brewing quickly. Always be very alert when seeing doji.
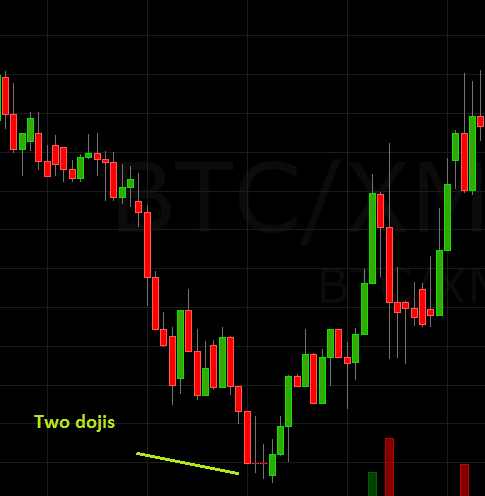
Two dojis are a certain sign that something is brewing in traders heads.
That's all for today folks if you show me love and interest I will write about indicators useful for cryptocurrency trading that can and should be combined with candlesticks for better understanding of the market trends.
If you are interested in broadening your knowledge on candlesticks for further reading I recommend books by Steve Nison, the man who brought candlestick reading to the west. Start with this one (Japanese Candlestick Charting Techniques).
I authored all the images using trading platform Coinigy.com
Excellent article, you put a lot of work into this!
Absolutely fantastic article. I didn't realize how much information could be gained just from looking at the individual candlesticks.
Thanks to @m1r0 for making me a bit wiser with my trading :)
Great article very insightful I learnt alot
This post gets a 2.78 % upvote thanks to @m1r0 - Hail Eris !
This post has received a sweet gift of Dank Amps in the flavor of 4.55 % upvote from @lovejuice thanks to: @m1r0. Vote for Aggroed!
Congratulations! This post has been upvoted from the communal account, @minnowsupport, by m1r0 from the Minnow Support Project. It's a witness project run by aggroed, ausbitbank, teamsteem, theprophet0, and someguy123. The goal is to help Steemit grow by supporting Minnows and creating a social network. Please find us in the Peace, Abundance, and Liberty Network (PALnet) Discord Channel. It's a completely public and open space to all members of the Steemit community who voluntarily choose to be there.
If you like what we're doing please upvote this comment so we can continue to build the community account that's supporting all members.
@m1r0 got you a $0.98 @minnowbooster upgoat, nice! (Image: pixabay.com)
Want a boost? Click here to read more!
Upvoted!
This post has received a 2.60 % upvote from @booster thanks to: @m1r0.