CHART ART: XAG/USD Silver Flash Crash Edition. Was it a Fat Finger?
What is a Flash Crash?
After reading the headline to this post, I know a lot of you might be asking what the hell does it even mean when you say a 'flash crash'?
A flash crash is a very rapid, deep, and volatile fall in security prices occurring within an extremely short time period. A flash crash frequently stems from trades executed by black-box trading, combined with high-frequency trading, whose speed and interconnectedness can result in the loss and recovery of billions of dollars in a matter of minutes and seconds.
That first sentence is pretty much an exact description of what you will see in the 1 minute Silver chart coming up below. Patience...
When it first happened this morning during the Asian trading session, the chatter was all about it being a fat finger. Essentially suggesting that it was just an obvious error in a big player's order where he might have added an extra couple of zeros onto the end or something of the like.
A fat-finger error is a keyboard input error in the financial markets such as the stock market or foreign exchange market whereby an order to buy or sell is placed of far greater size than intended, for the wrong stock or contract, at the wrong price, or with any number of other input errors.
So might we have just seen a half asleep bank trader at 2am in London putting on an extra couple of zeros at the end of his sell order? As ridiculous as this sounds, these types of errors do in fact happen.
While financial markets have pretty much moved past the days where a single bank trader will be in his office alone punting for example, Deutche Bank's money by manually entering a silver short position, automated trading hasn't exactly minimised errors. They're just committed by machines rather than humans now haha!
It all has a very Skynet ring to it, doesn't it...
However, going back to the first Wiki article, I found this explanation of the 2017 Etherium flash crash most interesting:
On June 22, 2017, the price of Ethereum, the second largest digital cryptocurrency, dropped from more than $300 to as low as $0.1 in minutes at GDAX exchange. Suspected for market manipulation or an account takeover at first, later investigation by GDAX claimed no indication of wrongdoing. The crash was triggered by a multi-million-dollar selling order which brought the price down, from $317.81 to $224.48, and caused the following flood of 800 stop-loss and margin funding liquidation orders, crashing the market.
The Etherium example paints a flash crash as a more natural market event. Simply a large sell order hit an illiquid market that triggered endless stop loss orders and with no buyers to absorb them, price just kept slipping.
But I actually have a feeling that what we saw in Silver today was just a natural market event similar to this. Something I try to explain in my chart art analysis below. Yes we're getting there, still patience...
Isn't it ironic though, that after all the shit that physical Gold and Silver traders give to the crypto guys for their market's being unstable and illiquid, that this happened on Silver of all markets. The 3rd most traded commodity out there behind Gold and Oil.
Chart Art
So that's enough talk, let's FINALLY get around to looking at the charts. Obviously Silver is represented as XAG/USD in forex markets and that's what we're looking at below.
XAG/USD (SILVER)
I can't believe that my CHART ART posts featured Silver before I did a post on Gold. But if you haven't noticed, I don't do things the normal way :)
Because we're looking at a flash crash that is all about the intraday chart, I've presented my charts in reverse to the way I usually do them. Normally I'd go from a higher time frame first and then head into the intraday chart.
But here's the intraday chart for effect.
Are you ready?
1 Minute:
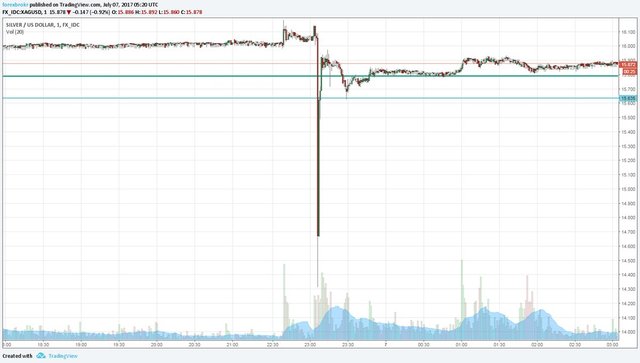
BOOM!
I'm sorry if you were leveraged up and short... Your account was just liquidated.
BUT SERIOUSLY, WHAT THE FUCK IS THAT?!?!
So now in reverse, let's take a look at the daily chart and try to explain it.
Daily:
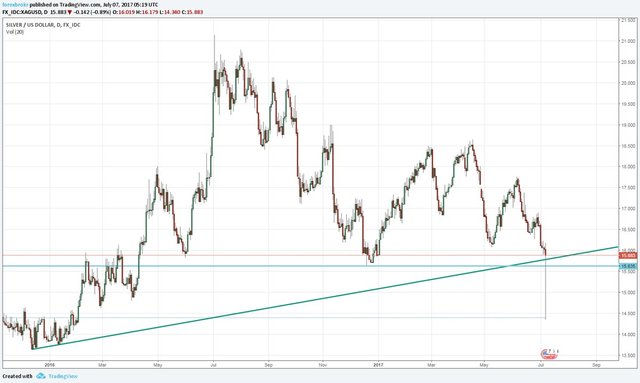
As I said above, this actually looks more like a natural market event rather than a fat finger or human error. This simply looks just like a large sell order hit an illiquid market, then triggered endless stop loss orders. Then with no buyers to absorb them, price just kept slipping.
On the daily above, you can see that price was hovering at a confluence of support between both that daily trend line that has been in play since 2015 and horizontal support at the previous swing low from 2016. That's two pretty significant levels that years worth of orders would have been placed around.
There would have been a tonne of stops sitting just below this level and in illiquid Asian session trading, we know things can get out of hand quite quickly when sell orders all start triggering with nobody in sight to buy.
It's definitely a jungle out there!
Don't forget that the charts in Wednesday's CHART ART post are still in play so make sure you take a look at that post here:
Please leave a comment, share a chart or tell me your ideas. Blogging about markets is all about sharing ideas and making us see all possible angles of the same chart. I look forward to reading what you throw at me :)
Peace.
Great write up mate, you have a really fast paced, yet informative style. How's that bounce right off the top of the 2016 support zone. Techs levels don't work eh? There's a special tag for gold and silver bugs somewhere ...
I only just discovered the #teamaustralia tag, now there's another haha!
#steemsilvergold it looks like. Cheers for the heads up again.
No worries mate! There's a tag/community for almost everything. Would be cool to get a coin collecting one going if it's not already around.
Come on this is in no way a "natural" market event. This is a blatant attempt byr some large entity to rig the price lower, flush out long stops and presumably extricate themself from unprofitable short positions ahead of Non Farm Payrolls today. Crashes of $540 million never happen to the upside, and clearly there would have been virtually zero physical orders filled. Complete and unabridged manipulation. I lost thousands because of this illegal action and sure am not alone. One thing is for sure, there is no way I am trading again. Well and truly butchered by the bankster bastards.
Hey jeddaw,
Was it a big leveraged long with a tight stop that got slipped big?
What exact prices were your stop and fill at?
They aren't chasing you for negative balance are they?
It was a leveraged naked long on spot silver with a stop set-up on the margin balance rather than a spot price. They are not chasing me for negative balance (fortunately) as they closed it out with a substantial loss which was just over my pre-set margin limits.
So you were essentially trading with a margin call as your 'stop'?
I wonder what the actual fills for traders with stops just below market when it dropped were and if that would have changed anything? (not knowing your strategy and risk profile within it of course)
You can control the margin risk profile in my settings. My other positions were hedged. Here is an interesting link for you...
Silver Flash Crash - Emergency Fund
Yesterday, on July 6th at around 11 p.m. (UTC), the Silver market briefly fell by 10% to 14.399 USD before quickly recovering to around 15.9 USD. This phenomenon is commonly called a "flash crash" and mainly caused by a fat finger error or technical issues. It is still unclear what caused this crash, but it affected all exchanges and derivative providers around the globe.
Especially for businesses like 1Broker, who offer high-leveraged contracts, such extreme volatility leads to many unpleasant side-effects. In general, Stop Loss values are not guaranteed exit prices and many positions are force-closed with a negative value. In some cases, losses even exceeded the total account value which lead to negative account balances. Contrary to popular belief, high price volatility is not in our interest and does not increase our profits.
Apart from an outage due to high server load after this event, our trading engine worked correctly. However, we fully understand the frustration when losses are dramatically higher than the amount initially invested. Therefore, we decided to create an "emergency fund" to refund all losses exceeding the initial investments. We expect that in total ~65 BTC will be payed out in the coming hours. 1Broker will cover this amount in full from our reserves and no increase of fees is necessary.
To protect our traders in the future, we lowered the maximum leverage for our Silver and Gold market from 100 to 50.
If you have any questions, you can contact us at any time.
https://1broker.com/?c=en/content/blog&id=68
A goodwill gesture from the broker seeing the loss as a marketing cost? They'll surely get some new accounts out of that if it's the case.
Yeah, since weeks everyone screams Silver is rising, and now THIS! All it does was fall. That's ok, as it will rise again. But a f* flash crash?!! Ok, happening to cryptos occasionally. But the entire world's silver market?
THANK YOU JAPAN. Now I got liquidated. Well, better luck next time : )