CHART ART: BTC/USD and STEEM/BTC
GOOOOD EVENING STEEMIT!
Okay, I've finally got my act together on TradingView. No longer do you guys have to stare at my disgusting MT4 charts that I hadn't even set up coloured candles on when I post my analysis. I actually feel bad at how lazy I was and fully deserved the shit engagement I received.
If you're a trader and don't know what TradingView is, please do yourself a massive favour by clicking that link and setting yourself up. The charts are accessible anywhere, they're clean and running your own technical analysis on them is a breeze. But my favourite feature is the publish idea button where you essentially snapshot your chart analysis, attach your views and then get a link where anyone can 'press play' on the chart so you can see how it all panned out. Talk about accountability.
Chart Art
Well, I've always liked the name CHART ART. I know it's an old BabyPips thing, but I'm grabbing it and running with it before I get a knock on my virtual door from their lawyers! :P
The idea is that I want to feature a couple of different markets each time I post a CHART ART update. I will keep them clean and the setups digestible. So what I've done is set up my TradingView profile with higher time frame levels that if hold, will indicate to me that a chart is in play and worth analysing/trading intraday. It's analysis like this that I'd normally do for my own trading, but will now also post here.
My trading style is VERY simple, clean and can be summarised in just a couple of sentences:
"If a higher time frame support level holds, then I will zoom into an intraday chart and look to buy any short term resistance turned support while still above the higher time frame level."
(The above is obviously for long positions and just needs to be reversed for shorts.)
I know it will be worthwhile to post a more in depth post on my trading method including how I manage risk, so just bear with me. How I trade is so simple and common sense that sometimes it hurts. So if you're a trader or looking to get involved in markets, give me a follow and upvote so I have the motivation to poor more time into the blog!
Ok ok, thats enough whoring, let's finally get into the charts. Tonight I'm just focusing on the crypto space. I don't really care if it's a cowboy market or whatever negative garbage you read around the place. The fact of the matter is that it's a liquid market that is moving around strong support/resistance levels, which put them in play.
I've gone Bitcoin/US Dollar and our old friend STEEM/Bitcoin for today's edition of CHART ART below.
BTC/USD
Now that Bitcoin has come off its emotionally fuelled highs and things are settling down again, we can start to analyse the market just like we would on any other chart.
First up lets take a look at the daily chart:
Daily:

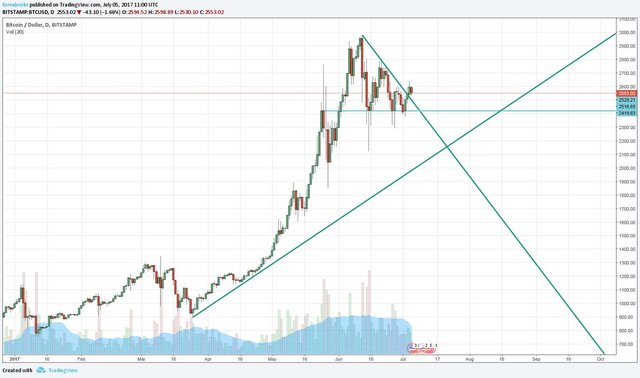
That is NOT a parabolic chart that shows a bubble. That is an extremely bullish long term chart that continues to experience healthy pullbacks into supply, where the buyers just wait to snap up whatever is offered to them.
The fact that each of these pullbacks come around $1000 round number psychological levels, just exaggerate how technical and predictably this market trades. It is almost a trader's dream!
So back to what we actually see on the daily chart and it's a massive bullish trend capped by the $3000 psychological resistance level, that has now pulled back into a previous area of higher time frame resistance turned support. As long as that level now acting as higher time frame support holds, I'm a buyer.
We now zoom into an intraday chart to look for entries that give us the risk:reward that keeps us in the game. In this case, I'm focusing on the hourly:
Hourly:

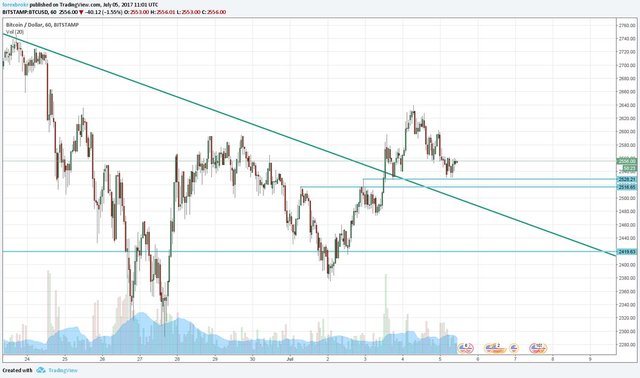
I'm pretty much ignoring that down sloping trend line and the only thing that matters to me on that hourly chart is the pullback into short term resistance turned support. Price is above daily support, so I'm only looking for longs and these are the in play levels that we can enter around to milk the highest risk:reward ratios from our positions.
Something I like to do (and as I said above, that will be explained in more detail if the upvotes and follows show demand /whoring), is enter an initial position with my stop below the higher time frame support zone and then once it goes my way, add into it with further positions with tighter stops. If you get a market that goes your way with the momentum that you are playing for, you can build a HUGE low risk position pretty damn quickly.
Price is at one of these short term pullback levels now so let's see how this one plays out.
STEEM/BTC
Secondly, I couldn't do a crypto CHART ART post without bringing up a STEEM chart :)
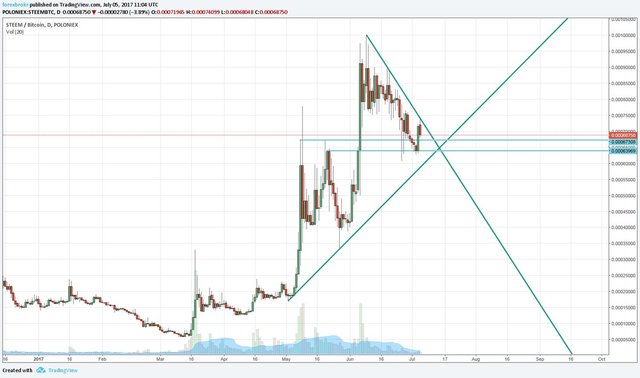
The daily chart shows the same emotional loss of control that we saw in Bitcoin, with that huge spike into new highs:
Daily:

But now that price has pulled back into once again, clear previous resistance turned support on the higher time frame chart, we can look to buy.
Exactly the same as above in Bitcoin, we now step down into the intraday charts to try to find short term pullbacks that offer levels to manage our risk around:
15 Minute:

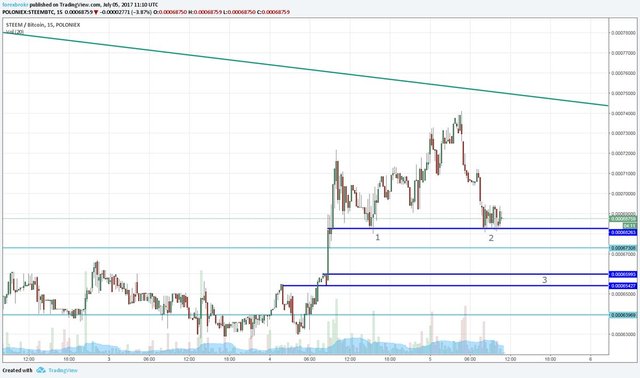
I've gone the 15 minute chart here simply for clarity in the pullbacks that I'm analysing, but it doesn't take a rocket surgeon to realise that the price levels are all the same no matter what time frame you're drawing your lines on!
So on this chart you can clearly see that the higher time frame zone has held and price bounced higher out of it. Price has then started to pull back into previous short term resistance turned support that I've also marked as 1.
It's bounced, making a new high, but couldn't sustain the momentum and has come back to retest the same short term resistance level turned support at 2. Now because it's only a short term level and has already been tested once, I don't think it's a good idea to be buying it again. Sometimes they hold, but you don't make consistent money trading setups that sometimes work. I'm happy to let that one go for now and see how it plays out further.
If it breaks lower, then I will be jumping at longs around the number 3 which is a short term level that never really got retested.
Well that's all for this evening's CHART ART offering. Please leave a comment, share a chart or tell me your ideas. Blogging about markets is all about sharing ideas and making us see all possible angles of the same chart. I look forward to reading what you throw at me :)
Peace.
Love the chart break down and always keeping it simple is the best way 🙌🏼
Cheers stackin.
It really is. In my opinion, the only thing that really matters in the end is how you manage your risk. Simple, higher time frame support/resistance gives you places to manage your risk and build an intraday position from there.
@bulleth got you a 8.48% @minnowbooster upvote, nice!
Want a boost? Click here to read more!
Nice work mate. Upgoat and resteem.
(pixabay.com)
Cheers 🐐.
I do want a boost. And I will read more.
😎.