CHART ART: USD/JPY Double Top Pattern x3 **HOW TO MAKE A SHIT-TON OF CASH TRADING FOREX!!**
So Steemit.
Do you remember the USD/JPY Double Top Pattern that we traded? Click the link to read the full post, but here's a little refresher of the higher time frame level that mattered:
4 Hourly:
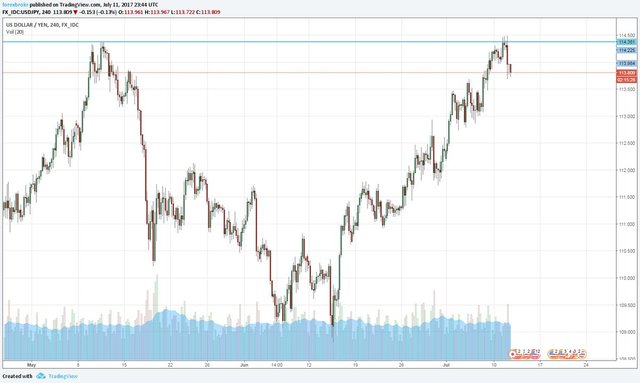
That was the 4 hourly level that clearly showed a double top and price subsequently being rejected from the second touch of the level. Exactly what we look for when we're trying to set up building a short position.
The setup unfolded BEAUTIFULLY and we milked the bad boy for +12 UNITS PROFIT. Click the link, each chart is posted one by one, in real time, down through the comments.
Happy days!
...
Well sort of. That depends on what you did with your positions from there... or how much hindsight gets to you.
Pleaseeee tell me that some of you are still in?!

Just take a look at the chart right now:
15 Minute:
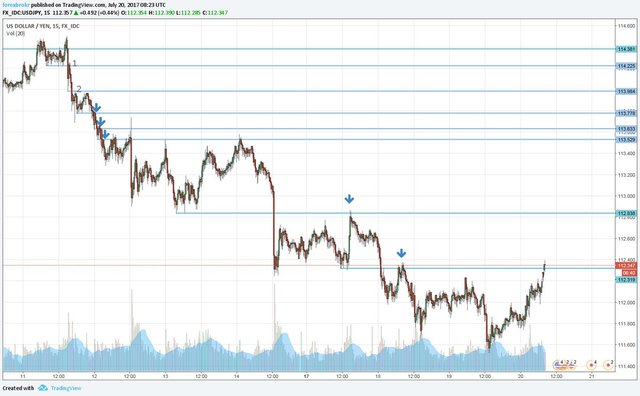
Just step, after profitable step, after profitable step x100000.
The type of trades that can make not only weeks worth of profit, but months or even entire YEARS!
This trade is the exact reason that you add into winning positions and shows just how to make a shit-ton of cash trading forex!
Peace!
Related @forexbrokr CHART ART Blogs
CHART ART: USD/JPY Double Top Pattern Continued +12 UNITS PROFIT!!
Instagram: @forexbrokr
Website: www.forexbrokr.com
I havent spotted this trade .. this is like picking bags of money on street, good trade.
Haha what a great analogy :)
Cha ching!
Indeed, that's a big nice one! I confess that I have to look more often at UJ chart, too focused on EU and cable. Anyways, Your analysis shows how good 4H and 15M TF work together, in my opinion the right combination to do nice swing trades. Thanks for Your article, continue the good writing!
Thanks bongo.
I just try to show that you need to start with a higher time frame support/resistance level (whether it's monthly, daily, 4 hour), and then move down to an intraday chart to get a good entry (1 hour, 15 minute, 5 minute). Both timeframes have to be saying to trade in the same direction.
Definitely add USD/JPY to your list. All of the majors are my bread and butter. So clean and liquid.