Elliott waves to forecast the Bitcoin price: Double Zigzag or Impulse + Fibonacci retracement.
Dear Steemians!
Recently I have posted about the figure for the corrective movement of the BTCUSD price.
Here I have some updates. Two more ideas. Both of them assume, that the zigzag pattern is over:
The red idea:
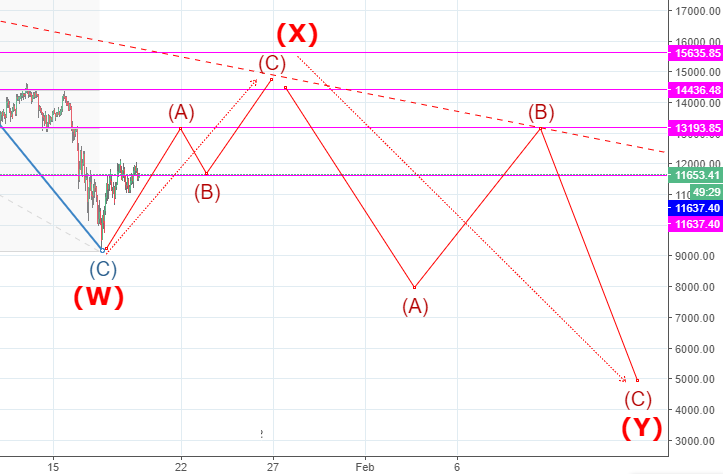
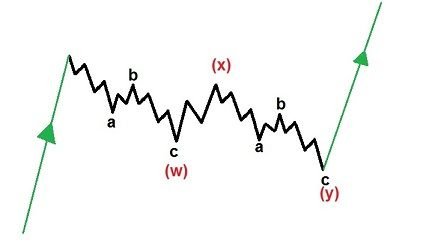
The correction is not still finished and we are about to draw the double zigzag pattern:
The blue idea:
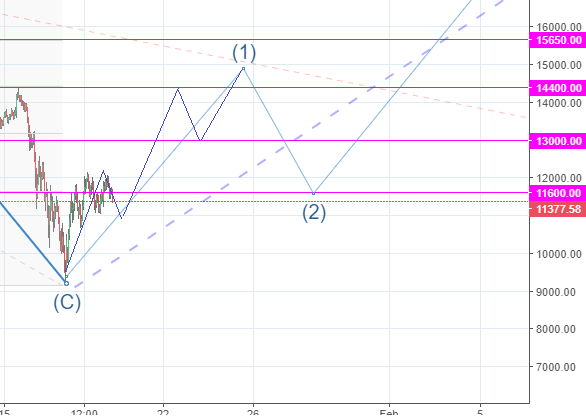
The simple zigzag is done. Now we are going to make the 1st wave in the impulse and get to the new hights.
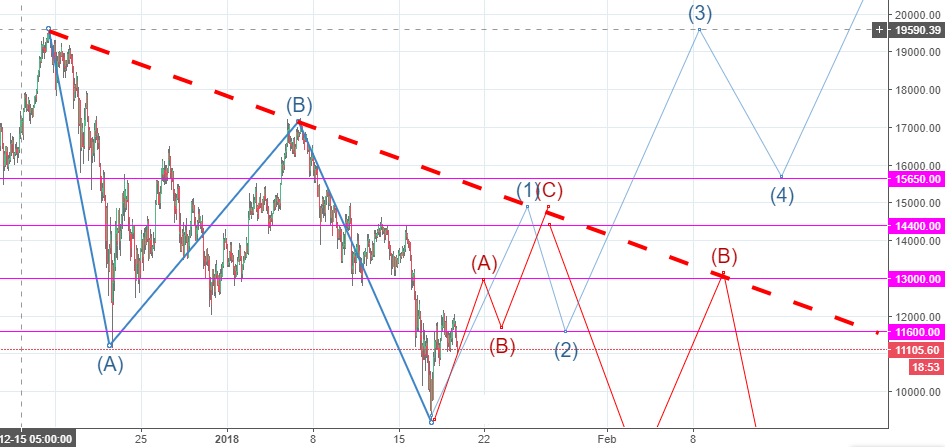
Here are both ideas depictedt on one chart:
!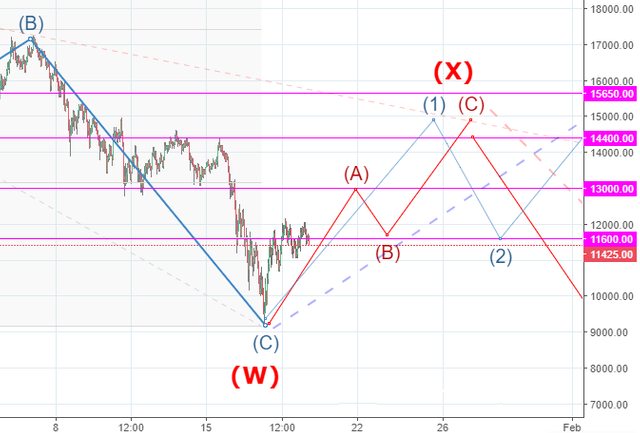
The post is aimed to show you, that even if we reach the 15640 level, we still cannot be sure, that correction is done, but the hint is hidden behind the structure of the 1-st wave or W-X. If it will develop as a 1-2-3-4-5 impulse - we can feel bullish and bearish, if it goes like A-B-C.
The good point is that for now, it does not really matter, what sort of wave is it. If the simple zigzag is done - we can be bullish for a short term. And here is a Fibonacci retracement to help us with support and resistance levels:
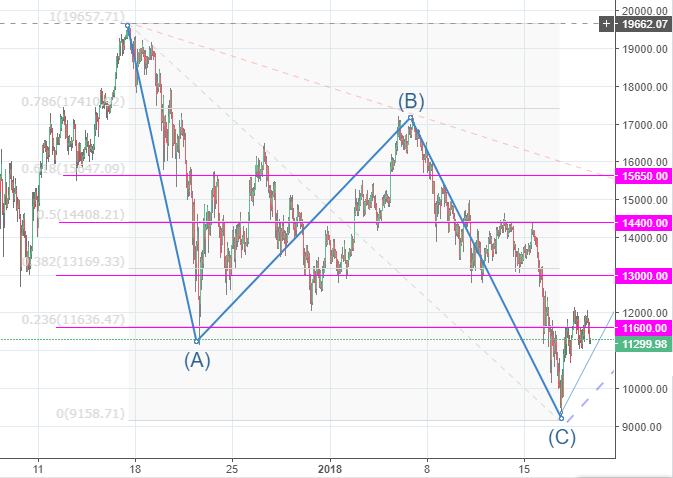
There are 4 resistances/support levels matching the Fibonacci retracement line:
$11600 (0,236)
$13000 (0,382)
$14000 (0,500)
$15640 (0,618)
Now we are on the 0,236 level. For Bitcoin higher velocity it is common. Something between 0,382 and 0,618. So let's see, how the wave will develop since now. The first target is $13000.
Everything was perfect, if we were sure, that correction is now done. The C wave of the simple zigzag can be finished. Remember the picture from the previous post:
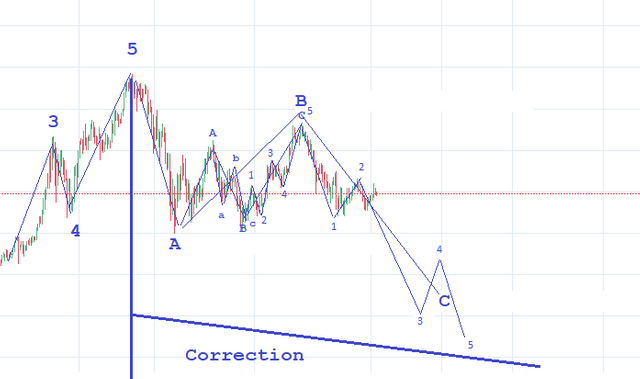
If that is true, the C wave is unfinished and prices can fall any given moment.
So please be very careful now and use stop-loss orders.
Stay tuned!
P.S.
Plase not the red downtrend line. It could be useful if we go red or blue way
Very detailed analysis man, the only think i can add is that any of those important moves must be followed with a proper trading volume to confirm either way, so far we have seen relatively small trading volumes so things needs to pick up, or the zigzag will continue.
Yup. Thanks for that notice. The most unpleasant movement is a slow downtrend.
Look, @cryptosludge, what do you think about that: the 4h chart starting from Novemeber. See the volume.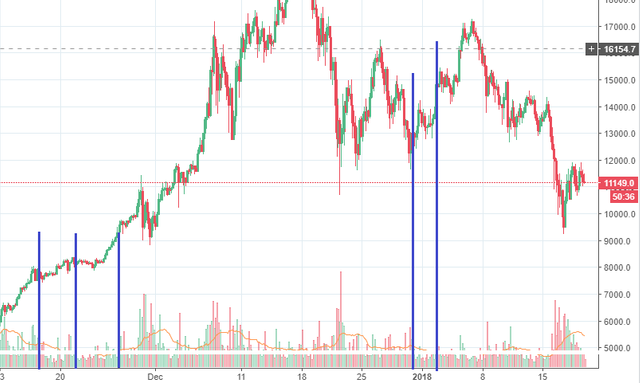
These cuts with blue are showing that when the volume was lower than today, the price went up. I understand, the market capitalization now is higher, but anyway. What do you think about it?
Yes, i agree the biggest issue with BTC is that it trades on many exchanges, so identifying on which exchange the action is actually takes place is the real challenge, by that i mean which exchange is leading the trend, and it's not always the same, sometime it's finex sometime the koreans, sometime coinbase. I also noticed that this cycle of downtrend also ran on relatively small volume and it does applies to your observation of the upper trend on low volume.
@originalworks
Very good analysis, being ready for all possibilities.
Thanks, but unfortunately there is no clear forecast. Just possibilities waiting for confirmations
Yes