Puzzle of the week. What is the next move of Bitcoin? Let's find out together.
All right, folks!
One of the most difficult task for traders it to understand, where are we now in the overall wave structure (we are talking about the Elliott Wave Principle). If had an answer - we could forecast the price movement.
I would like to solve that exercise. And Seemit is definitely the best place to do it!. Here we need help of powerful traders and all the community to voteup the best solutions! Instructions are below.
The concept of Elliott Waves allows us to predict the behavior of... us.
So let's do it! Makes sense!
Shortly about the waves:
The pattern:

Now let's get to practice!
The real picture (1d BTCUSD chart Oct 2017 - Jan 18) :

What we know for sure?
There was an all-time-high ($20 000) in the middle of December, so let's mark it with "5" and split the chart into two parts: motive and corrective. Let's also mark the waves on the motive side so it was more-less similar to the pattern.
Here is what we've got:
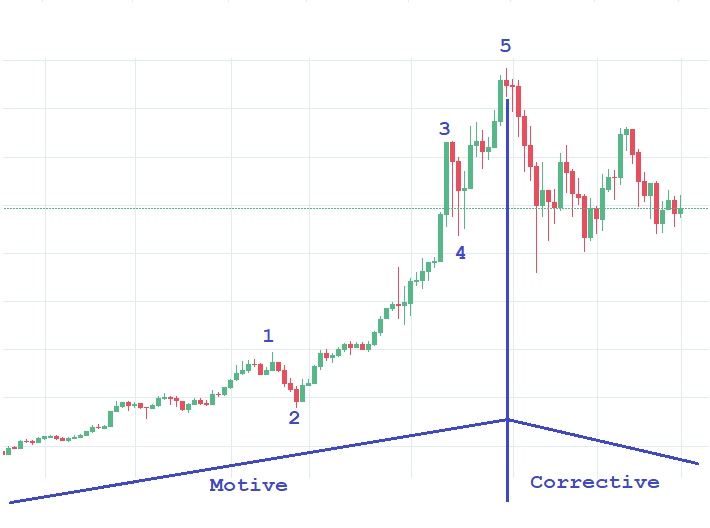
Here is some theory. The impulse characteristics:
- The 3rd wave top should always be higher than the top of the 1st one.
- The 2nd wave ending does not go below the beginning of the 1st wave.
- The 4th wave ending does never go below the top of the 1st wave
- The 3rd wave cannot be the shortest one in the impulse.
Yes? Yes.
Let's now check out the corrective side. Can we be sure that the correction is ended? No. Why? Because there is a lot of types of correction and current image be a match few of them.
Here is the list of corrective figures:
- Zigzag
- Double Zigzag
- Triple Zigzag
- Flat
- Expanded Flat
- Contracting Triangle
- Descending Triangle
- Ascending Triangle
- Expanding Triangle
- Double 3's
- Triple 3's
Now our task is to act like Sherlock Holmes: "eliminate the impossible, whatever remains, no matter how improbable, must be the truth
And here I need your help, folks!
Here is the 4h BTCUSD chart, so we have zoomed corrective part. I remained it unfilled, so you could use that sketch to draw your own idea.

Please use that image to draw your own corrective idea and post it in comments.
Here you can find the images of corrective figures.
You can also check out the Wave Counting Tutorials posted by @haejin
I will support you with theoretical materials on run. Post your ideas and I will help! Ask me if you need something.
And voteup the ideas you like! Maybe your idea will the most elegante.
Trading is an art, isn't it?
Let's put our heads together and find out the most credible ways for the BTCUSD chart.
I will start!
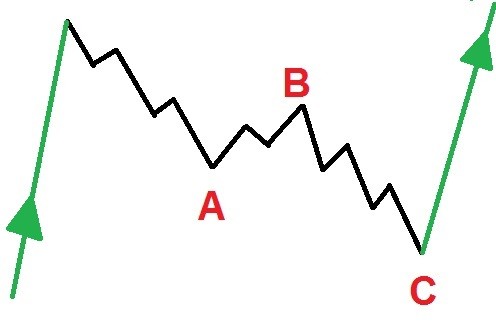
Here is simple Zigzag:
And here is how can we apply it to our chart:

And here is some theory regarding Simple Zigzag
- wave A is an impulse (1-2-3-4-5)
- wave B is a correction (A-B-C)
- wave C is also an impulse (1-2-3-4-5)
Let's apply the "wave B is a correction (A-B-C)" to our image:
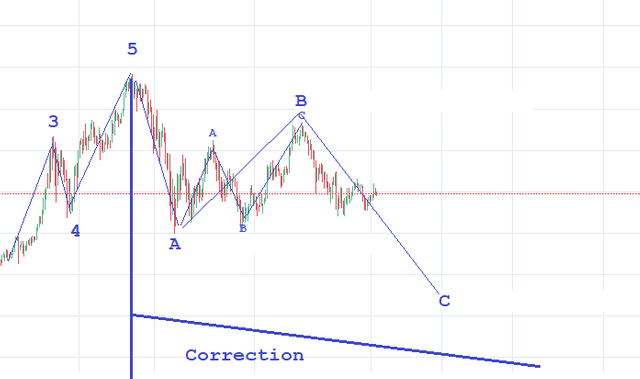

Wow... Do you also see that? Remember the rule?
- wave B is a correction (A-B-C)
Have you heard about the fractals my little psychonaut ?
Check this out:

Let't aslo add impulse (1-2-3-4-5) structure to the C wave (the small one):

And now let's get to the future.
C is an impulse:

So what do we have?
If that model will work... $5000 for BTC is something very real. In the last wave C 3rd wave must be at lease as long as the 1st, but. But does the big A wave (that one, which starts from "5") look like an impulse?

Hard to say... Does it look like true?

A bit more theory:
- In impulse wave 1-2-3-4-5, corrective waves 2 and 4 both have A-B-C structure.
- In impulse wave 1-2-3-4-5, motive (or impulse) waves 1, 2 and 3 are motive (or impulse) and have 1-2-3-4-5 structure.
What do you think about that construction? Does it look realistic or... not?
Thank you for reading! I hope you like the idea!
Please share your ideas and draw your thoughts!
Charts are taken from www.tradingview.com Please share your tradingview ideas as well. Here is one mine (image in post is clickable).
Here are some corrective patterns:
Simple Zigzag
.jpg)
Double Zigzag

Descending Triangle

Ascending Triangle

Contracting Triangle

Combination Corrections (double and triple 3's)

Simple Flat

Expanded Flat

@dkn I would like to add that BTC is simply a victim to the Futures market lately ... the various futures contracts that were added can incorporate previously unseen downward pressure (ie. a new market dynamic). Traditional futures traders are now suddenly trading something that they do not understand.
We'll see! Thaks for reminding about the futures. Futures, closed registration in stocks, crazy news... Problably old patterns can be just broken one day.
I tend to agree ♦♦ Knew (sensed) that when those damn futures traders got in here it 'd mess with BITC.
Sorry to be negative, but I did not really like it when i saw CBOE piled in.
Anyway, liked yr comment.
Take care
I personally dont believe it will follow through with that pattern or fall below 10k USD due to the billions of dollars coming into the market on a daily. Bitcoin is still in its early stages.
Good read, well written :D
Thank for the feedback! Yes, newcomers are protecting us from the big fall, but fear of losing money... That's all about fear. Newcomers we also afraid to invest in "falling" staff. I guess these patterns consider newcomers as well.
Good post dkn, helps newbies to read the market. Thank you!
It will go down for years
@originalworks
Excellent Post! I believe the correction will last another one to two weeks. There are game changing announcements coming in the next two weeks, possibly any day! I would buy large positions in ethereum and bitcoin in the next week or two.
Thank you for the feedback! The market has already made a sharp step down since posted. Exciting time! The priced went below $12000
Thanks for posting some great analysis - the more eyes on BTC the better. A lot of people on this platform are probably wondering what to do and when to get (back) in. We have to let the price do the talking!
Thany you for the feedback! I really hope that upvote system would pull to the surface the best analytical materials. Here is a lot of traders...
Very detailed analysis. Thank you!
It was very interesting to read. Thank you for your work.