Monero analysis: Chart patterns and price prediction
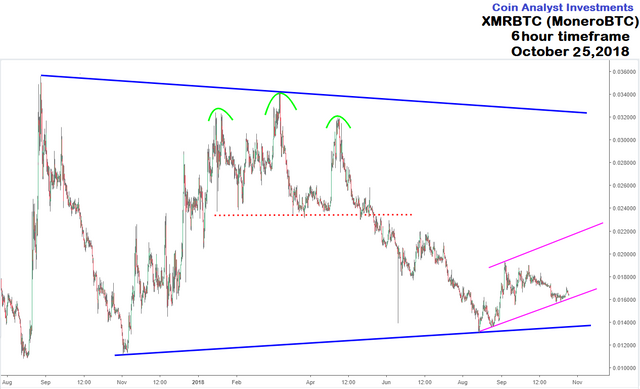
The 6 hour timeframe of XMRBTC (Monero) captures over a year and 2 months of price action.
The sideways price movement is best described in this analysis as a symmetrical triangle, with extremes of the chart pattern i.e. support and resistance indicated by the dark blue lines.

The most recent uptrend starting August 15, 2018 is described using a bullish channel that is tentative. A break below the channel, and also support at 0.015469 could result in price action reaching 0.013192 or lower.
A break above the channel however at 0.022360 could see the price action test resistance at 0.032487.
Interested in Bitcoin analysis (BTCUSD)? Check out our previous work below
https://coinanalyst.investments/2018/10/15/bitcoin-analysis-8/
Moreover, XRP chart analysis (Ripple) can be found here:
https://steemit.com/trading/@cryptotrader0029/ripple-analysis-today