Bitcoin Update- 25 Aug 2018
The charts speak louder than words
Daily Timeframe
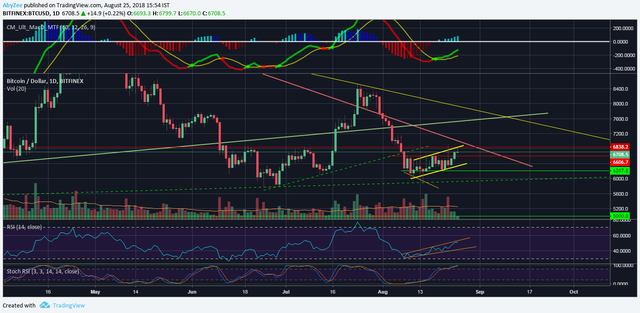
- #Bitcoin seems to be in the same range for the past two weeks.
- But it's rising steadily. See the price action between the two yellow trend lines.
- The RSI is also moving in the orange channel drawn in the RSI chart.
- Though it may have a lot of space to move upwards but look at the daily Stochastic RSI indicator.
- According to the daily Stochastic RSI indicator, bulls are losing momentum.
- If this holds true, this could be a massive bear flag. Look at the downward price action in red bars acting as a flagpole and the flag in the yellow trend lines.
- This can take us to $5000 - $4700 range.
- Although, I hope some good news in the market from ETF or something else and a bull rally.

Four Hourly Timeframe
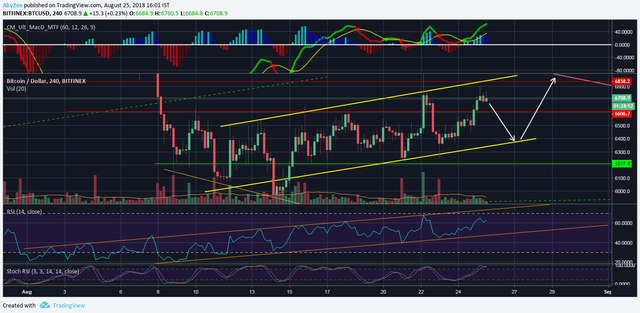
- This is a rising channel and in these days $6600 to $6400 has been the general range for #bitcoin.
- For now, bitcoin has crossed the $6600 level but it has to tackle a much bigger resistance $6800 level.
- The upper yellow trend line and the resistance of $6800 will together act as a hurdle for #BTC, stopping it to move upwards.
- On four hour timeframe also, the Stochastic RSI is indicating that the bulls are losing momentum.
- The white arrows show the possible price action if bitcoin falls again back down and the possible bullish move, getting support form the lower yellow trend line
- In this case, we may see bitcoin once more bouncing back into this channel up and down.
Hourly Timeframe
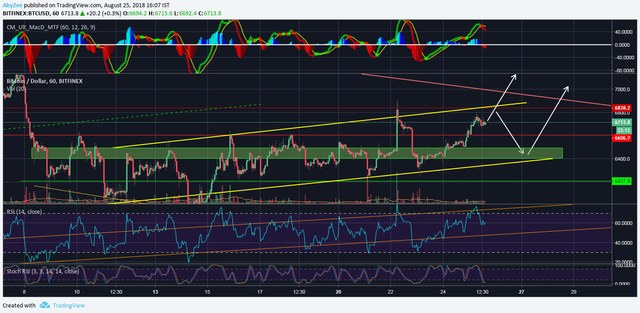
- $6500 to $6400 can act as a possible support area for bitcoin if it falls down.
- But on an hourly timeframe, the Stochastic RSI is in the lower region, telling that if we get some decent volume then there is a possible bull move to break the $6800 resistance level.
- Or else, bitcoin will touch the upper yellow trend line and fall back down in the green rectangular region.
- A short position can be placed here, keeping in mind the previous price action. Because on the hourly timeframe bitcoin has already made some lower lows and the same in the RSI.
15 min Timeframe Trade Setup
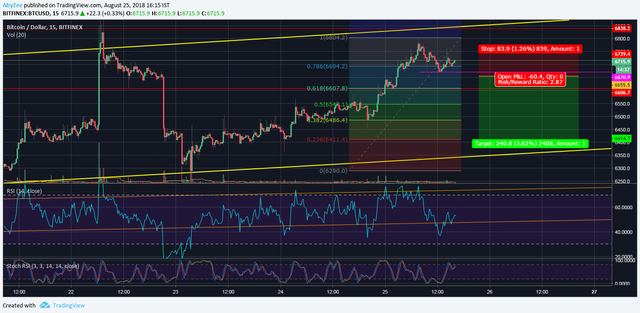
- Wait for the breakdown confirmation.
- Look for a lower low in the RSI at 15 min timeframe.
- The Stochastic RSI crossover and the momentum shifting downwards.
- Let it break down the $6670 level.
Position: Short
Stop loss: $6739
Take profit: 6414
Risk/Reward Ratio: 2.87

Disclaimer:
This is purely a technical analysis and it is to be used for entertainment purposes only. This is not a financial advise to buy or sell Bitcoin and I am not a financial advisor. Do your own research before investing.

Please Upvote and Resteem

I appreciate your support
Follow me @ABYZEE

![]()
Nice TA. Let's see how it plays out... ✌
Hello abyzee!
Congratulations! This post has been randomly Resteemed! For a chance to get more of your content resteemed join the Steem Engine Team
Thank you
Keep supporting :)
@resteemator is a new bot casting votes for its followers. Follow @resteemator and vote this comment to increase your chance to be voted in the future!
I can't believe that is true!... but I also couldn't believe it wasn't butter. No really. That stuff was actually butter right?