STELLAR: This seems to be a TA "Handbook" breakage
8 days ago I wrote a post called "STELLAR: Let's focus on other promising altcoins" on which I was alerting about what I thought was a perfect Setting-up for an ALTCOIN reversal, in this case STELLAR.
In particular I drafted the following sketch:
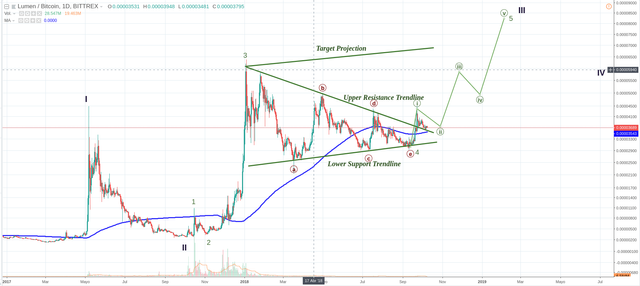
The scenario on the daily chart was indicating both, a breakage of the triangular Pattern through the top Resistance trendline together with a breakage of the price line by the 200dMA line (dark blue)
Also, the previous high (d) was broken...
What we have as a result just 8 days after is this:
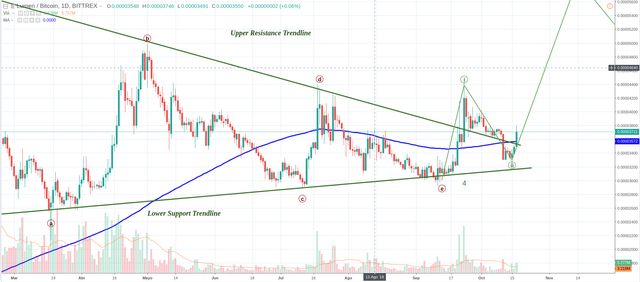
STELLAR has corrected as predicted on (ii), crossing a little the "upper Resistance Line" which is now a support.
At the 4h-chart the rise is more than evident and, as a possible path it could follow the one I propose below:
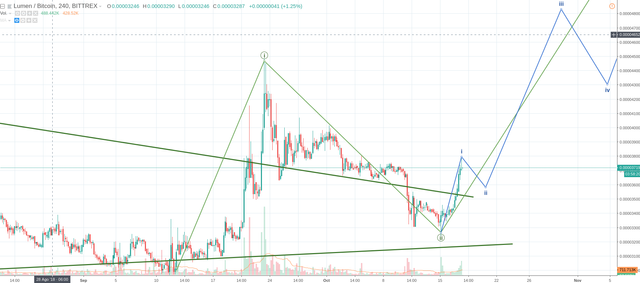
(iii) green wave in construction right now which its division in 5 sub-waves (blue) may tell us that the 1st sub-wave is almost completed.
All in all a fully confirmation of Reversal Trend for STELLAR...
At least we have some nice indications of market recovery!!!
Enjoy!
*Disclaimer: This is just my personal point of view, please, do your own assessment and act consequently.
Neither this post nor myself is responsible of any of your profit/losses obtained as a result of this information.
Published on

by toofasteddie
