Lab Diaries #5 - Gene Set Enrichment Analysis (GSEA) of a Large-Scale Biological Data, Part I
In the previous post I have explained how we obtained our RNA-seq and TMT-MS data, and today I will introduce you to a very useful tool for analysis of such large-scale biological data.

Finding a meaning in your meaningless data
Imagine that you've analysed your RNA seq data, and after analysis you saw that you have more than 5000 differentially expressed genes after you have induced expression of a particular gene in your cells...
What the .... am I supposed to do with that information?!?
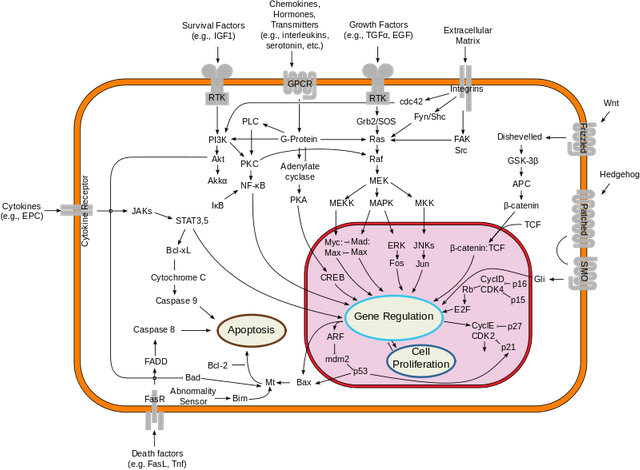
In each of our cells there are many, many (and one more time - many!) signal transduction pathways that include thousands of proteins, which are tightly regulated to keep our cells alive and functioning. In cancer cells, due to the activation of oncogenes, many of those pathways are deregulated to provide advantages to cancer cells over normal cells. These changes make them immortal, allowing them to grow indefinitely and eventually to migrate and invade other parts of our body.
Now let's get back to our "small" problem of having 5000 over- or under-expressed genes in our cells with high expression of an oncogene, compared to same cells with low expression of the same oncogene.
How can we know in which of these signal transduction pathways are all those genes included, and what is the biological meaning of those 5000 genes being changed?
Well, we could just go and analyse one by one gene and if we are lucky, just before retirement we would succeed in analyzing them all and finally publish our results 30 years after we performed an actual experiment...
Gene Set Enrichment Analysis (GSEA)
... or we could just use Gene Set Enrichment Analysis (GSEA) and publish our results in only 3 years, yeah!
If we're lucky... I mean, if we have any good results actually... Never mind, just keep reading...
GSEA is a very useful computational tool for interpreting gene expression data, such as microarray, RNA seq data, etc. The advantage of GSEA over other methods is that, instead of focusing on analysis of single genes, it performs the analysis of a group of genes. In this way, changes in pathways reflected through small, but coordinated change of several genes can be detected, leading to potential elucidation of biologically significant changes relevant for eg. process of carcinogenesis.
Gene sets
By using GSEA, we are actually trying to put our obtained results of differential expression into the previous, already known biological context. This is achieved by using the gene sets, which represent group of genes that are grouped together based on their common biological function and/or involvement in the same biological pathways. Those gene sets are formed according to already published biological data containing biochemical pathways or coexpression of functionally related genes. They are publicly available in the form of Molecular Signatures Database (MSigDB) on the Broad Institute web page.
GSEA principle
Gene Set Enrichment Analysis (GSEA) is a computational method that determines whether an a priori defined set of genes shows statistically significant, concordant differences between two biological states (e.g. phenotypes).
Definition taken from official GSEA user guide, because there's no other way to explain mathematical method behind the analysis. The algorithm used is fully described in this paper, and it's based on weighted Kolmogorov–Smirnov-like statistics.
Luckily for us biologists, our friends mathematicians have developed a user-friendly software, that performs analysis for us, the "only" thing we need to do is to prepare input files with our data in the form that will be recognized by the software. In the following lines I have prepared a detailed guideline on how to prepare your data and run GSEA.
GSEA Tutorial
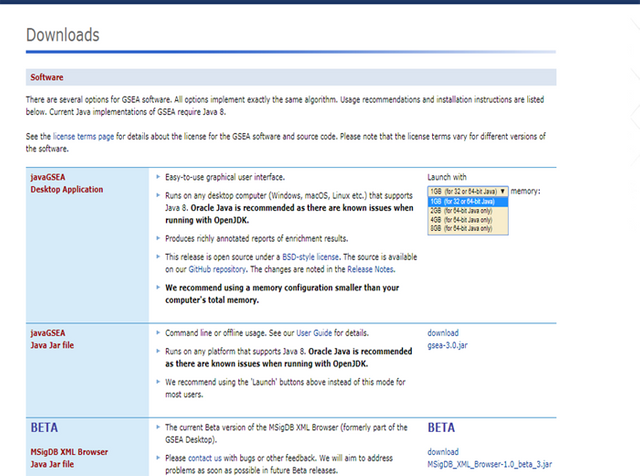
GSEA Software runs on Java, so before downloading and installing software, you need to make sure that you have Java 8 installed on your computer.
Very important information - GSEA Software is available is several memory configurations: 1, 2, 4 and 8 GB. GSEA of 1 GB can be used with 32- or 64-bit Java 8, other configurations require 64-bit Java 8 only!
If you run 64-bit operative system (Windows) on your computer, I recommend you to install 64-bit Java 8 and GSEA with higher memory configurations (2, 4 or 8 GB). Of course, you have to choose a memory configuration smaller than total RAM memory of your computer!
This has one very important practical implication - when you're analyzing very large data sets (eg. more than 10 000 genes) and using databases with large number of gene sets (we'll come to that later), it often happens that Java runs out of memory, and GSEA Software cannot perform the analysis. For example, my laptop has 8 GB RAM, 64-bit Windows 7 Ultimate, and I'm running 4 GB GSEA (quite enough for all the analyses I performed).
After you have installed Java 8, you can head to GSEA Downloads page and download one of the GSEA Software configurations.
Note - you will have to register to be able to access downloads page, your e-mail is required only.
Running the software
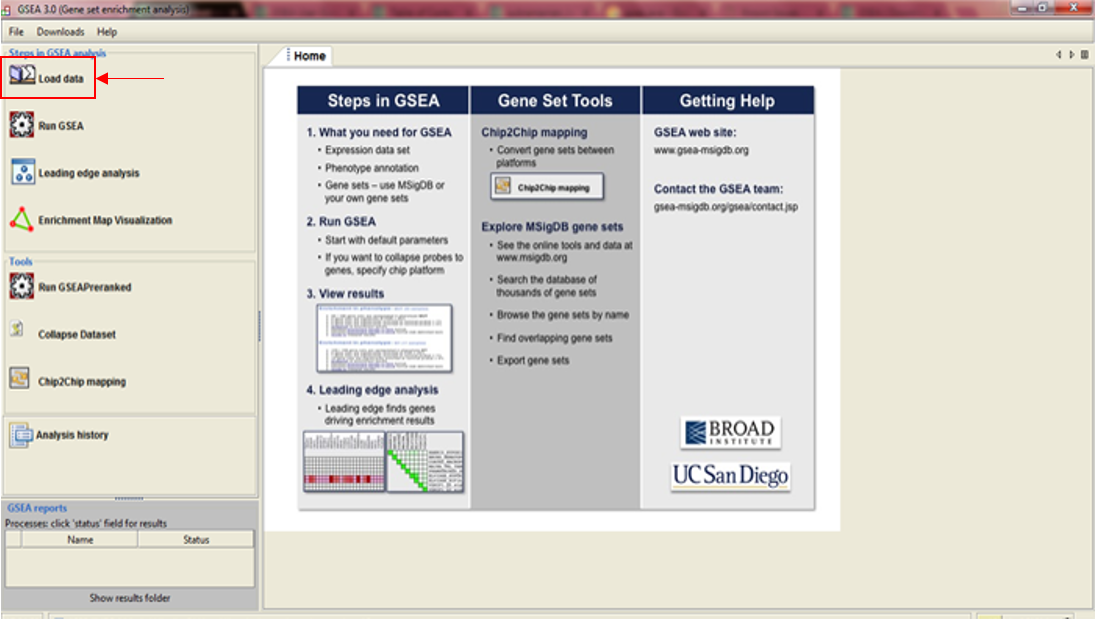
If you've successfully installed your GSEA Software, after launching it the main window opens, and it should look something like this:
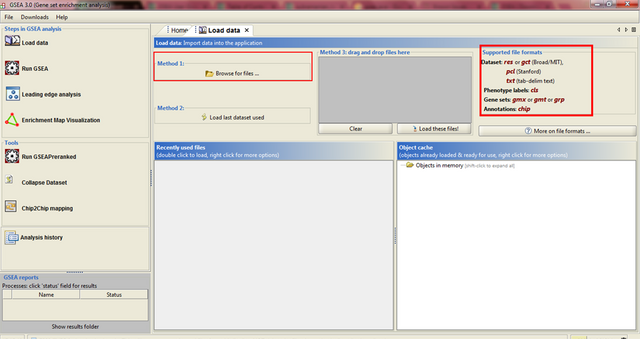
In the upper left corner click on Load data, and the following window opens:
Now we have arrived at the most important part of GSEA analysis - transforming your data into the GSEA input files. I'm saying this is the most important part because if you fail to create input files in proper format(s) acceptable by the GSEA, the software will report an error after you load the files and you won't be able to run your analysis.
So pay close attention! :)
If you take a closer look at the upper right part of the last image, you will see that software informs you about the acceptable data formats, Basically, it is essential that you have prepared the following two file formats before running your analysis:
1. Expression data set file (there are several options, but .gct file works perfectly fine for me) - this is your expression data set, actual data you obtained after performing RNA seq analysis
2. Phenotype labels file (.cls file)
Preparing .gct file
Usually your RNA seq data is contained (after initial processing) in one or more Excel files (you can see how it looks in my previous post. To be able to analyse it in GSEA, you need to adapt it into something that GSEA Software can read and understand, and that's called .gct file.
In the first step of creating your .gct file, open a blank Excel sheet and from your RNA seq data file copy and paste columns containing gene names and all replicates of your data.
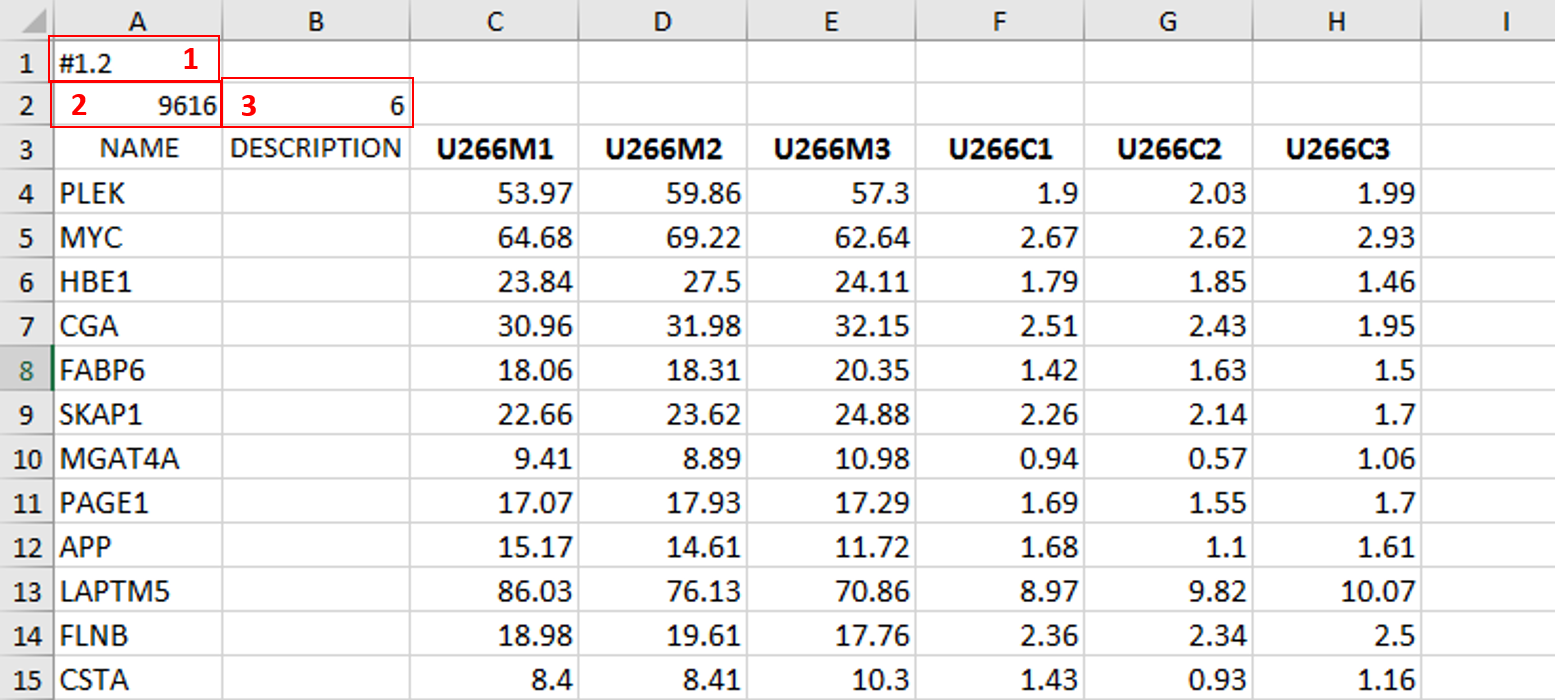
As you can see in the image, it is also necessary to have an additional column in between NAME and your replicates, which is called DESCRIPTION (I usually leave this column empty).
In the first cell of the first row (number 1 in red) you need to write this #1.2, and this is what each .gct file must contain, it represents the version of .gct file and GSEA uses this particular version/form.
In the first cell of the second row, you must input the number of your genes contained in .gct file, genes that you're analyzing (number 2 in red, in my example I had 9616 genes for the analysis). This is very important step, because if the number in this cell doesn't match the number of genes in .gct file, the software will report an error and won't work.
Finally, in the second cell of the second row (number 3 in red) you need to input the number of samples you're analyzing. In my example, I had 6 samples - 2 triplicates.
The order of samples matter as well, meaning that samples you're focusing your research on should be put first. In my example, I was interested in comparing expression in U266M samples with U266C samples (controls).
When you have finished creating Excel .gct file and it looks like mine example from above, make sure you save it as Excel file first. Then you need to save it as text (Tab delimited) file as well. So now you should have two files - Excel and text file.
Final step - open your text file and select Save as, then select All files, and just manually type extension at the end - .gct.
You should now have three files in your GSEA folder: Excel, text and .gct file.
Preparing phenotype labels (.cls) file
Phenotype labels file serves to provide information to GSEA Software on how many samples your .gct file contains, how many different phenotypes and which phenotypes are located in which cells.
Let's proceed to example immediately:

In the first row you can see following numbers: 6, 2 and 1.
6 represents number of samples you have.
2 represents number of different phenotypes you're analyzing. That means - tumor vs. control tissue, treated vs. non-treated cells, transformed vs. non-transformed cells. All examples of different phenotypes/states in your experiment.
1 is always 1, I actually don't know why :)
Second row (number 2 in red) tells to GSEA Software how your phenotypes are labeled, so the software can have information on what is one and what is another phenotype. This sign "#" must precede the first phenotype label (in the first cell of the second row).
Finally, third row (number 3 in red) provides information to software how many samples of each phenotype are being analyzed. In my example, 3 samples of phenotype U266M and 3 samples of phenotype U266C.
The rest of the steps are the same as in creation of .gct file - first make sure that you save your Excel file of .cls file.
Then save it as Tab delimited text file.
Finally, open the text file and change the extension to .cls. At the end you should have three files - Excel, text and .cls file.
In the Part II I will explain how to perform GSEA using files you created using this tutorial.
Until then, relax and keep steemSTEM! ;)
Literature
[2] GSEA User Guide
[3] Java heap space / OutOfMemoryError


Oh wow, this is prompting me to get my butt off Steemit during lunch and do some sideline research. It seems like gene sets have a pretty clear analog in 'functional guilds' in microbio. I wonder if anyone has translated the mathematics over into ecology.
In ecology - they need us :D
The most popular is an easy matrix algebra, "game of life" simulation
Or they measure various parameters and need some multivariate analysis to obtain the conclusion
And the latest fashion and the closest thing to your question is: environmental DNA (eDNA)
I hear what you're saying, but ecological modelling has progressed far beyond Conway's game of life.
etc
You are in the field... :)
And you just went to my auto-voter
Aww, thanks.
Hell yah, that's one comprehensive and specific guideline. :)
Unfortunatelly my recent biochem work does not need me to use it. -> But provides me with a lot of other problems ofc. Haha!
This is absolutely perfect! The best HowTo that could be found on the internet. Students should learn from this.
I can't wait for the Part III or II depending how you count
Hey @scienceangel, thank you for your contributions! This is a wonderful blog.
So does that basically mean that the more protein we consume the more dangerous it can be for our health? (Don't get mad at me if that's a dumb question :P)
Thank you so much for providing detailed information regarding the use of the GSEA software. Personally I'm an Engineer so I will never get to use this software, however I do appreciate you taking the time to create this tutorial as I know how vital this can be for young scientists in your field. (We all depend on software and tutorials :P)
Please keep up the great work!
Thank you very much!
Actually, it is a very good question.
It is quite normal that we ingest a lot of things on daily basis that are not necessary/in excess for our organism/cells at given moment - too much water, salt, carbs, fats, proteins, etc. Our cells of course have mechanisms of keeping homeostasis of intracellular environment, so when we ingest too much proteins for example, they will be digested in our gastrointestinal tract down to amino acids, which then hit the bloodstream. Cells will take up the amount of amino acids they need (especially muscle cells), and the rest/excess amino acids will be broken down in the liver to form ammonia. The liver converts the ammonia into urea, because ammonia is toxic. At last, urea is excreted from the body through the kidneys.
So when you ingest more proteins than your cells need, it will be just more work for your liver and kidneys :)
There are studies connecting red/processed meat intake with the increased risk of bowel cancer. This is however, not due to increased protein intake, but due to carcinogens found in processed meat, and if we are talking about red, non-processed meat, some evidence suggest that chemicals formed during digestion may damage the cells that line the bowel. Other causes may be the fat content, and the way it is processed or cooked; or just because people who eat preferentially red meat usually have low intake of "protective foods" such as fruit and vegetables or wholegrain cereals.
So take-home advice - make sure that you eat everything in moderate quantities (balanced diet), have plenty of physical activity, avoid smoking and drinking too much alcohol, and you'll be fine ;)
Hey, thank you SO much for taking the time to leave such a detailed response, I truly appreciate that!
So even excessive water consumption can harm our health? I've been drinking TOO much water for years!! Should I worry?
Again, thank you so much for providing such deep information in this thread! Your blog was spectacular to say the least, but you also wrote another mini post in response to my comment!
Stay awesome!
"Excessive" here means that you would have to drink 10-20 liters of water in a few hours to get hyponatremia and cerebral edema and possibly die :)
Interesting! Looks like we're in the same field of biomedical science and cellular/molecular biology. You have a new follower!
I like the new artwork. @atopy did a great job!
Also, great breakdown of GSEA. Its a useful tool, but even with its help its difficult to interpret large datasets like this.
Exactly, it's always challenging finding the answers from these type of datasets. As a matter of fact, I'm still dealing with this :)
lol, the one more time. True
This post has been upvoted and picked by Daily Picked #31! Thank you for the cool and quality content. Keep going!
Don’t forget I’m not a robot. I explore, read, upvote and share manually ☺️
Congratulations @scienceangel! You have completed some achievement on Steemit and have been rewarded with new badge(s) :
Click on any badge to view your own Board of Honor on SteemitBoard.
For more information about SteemitBoard, click here
If you no longer want to receive notifications, reply to this comment with the word
STOP