Analysis of the Mollier diagram to simplify the calculations of thermodynamic magnitudes.
Analysis of the Mollier diagram to simplify the calculations of thermodynamic magnitudes.
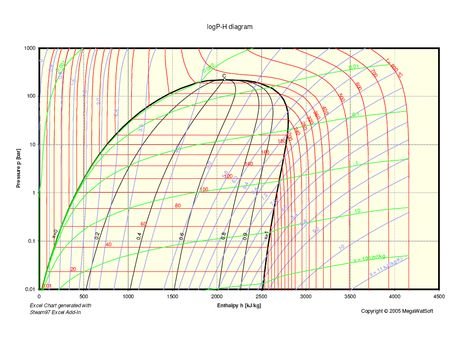
The enthalpy-entropy chart, also known as the Mollier diagram, has different technical applications. It is widely used to estimate the enthalpy of pure substances and the mixtures of substances that are most frequently found in Engineering.
Mollier's chart serves to simplify calculations of enthalpy, entropy, pressure, temperature, specific volume and the quality of steam and water. The Mollier diagram is the representation of the properties of water and water vapor. A main H-S coordinate system (Enthalpy-Entropy) is used.
Source
The diagram was created in 1904 when Richard Mollier plotted total heat against entropy. At the 1923 Thermodynamics Conference held in Los Angeles, it was decided to name, in his honor, as a "Mollier diagram" any thermodynamic diagram that he used the enthalpy h as one of its axes.
Source
How to read the Mollier diagram.
Source
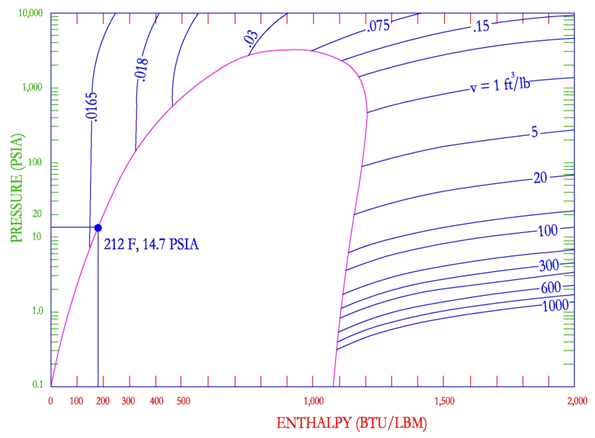
Constant Pressure Lines and Enthalpy Lines.
The horizontal lines are the lines of constant pressure, and the vertical lines are the lines of constant "enthalpy", that is the amount of heat present in a kilo of refrigerant.
Note that the pressures are absolute pressures and that the scale is logarithmic.
Enthalpy.
Although enthalpy is sometimes defined as "total heat", it is more correctly and specifically defined as the sum of all the energy supplied by a given mass of matter in any thermodynamic condition.
The formula for calculating the enthalpy is indicated below.
H: enthalpy (kcal / kg)
U: internal energy (kcal // kg)
P: absolute pressure (kgf / cm2)
V: specific volume (m3 / kg)
J: equivalent mechanical energy.
Saturated liquid line and saturated steam line.
Source
As the following figure shows, the diagram is divided into three main parts separated by the saturated liquid line and the saturated steam line.
The part to the left of the saturated liquid line is called the "sub-cooled zone". At any point in the sub-cooled zone, the refrigerant is in the liquid state and its temperature is below the saturation temperature corresponding to its pressure.
The part to the right of the saturated steam line is called the "recharged zone". In this part, the refrigerant is in the form of superheated steam. The central part of the table, between the lines of saturated liquid and saturated steam, is called "phase change zone", which represents the phase change of the refrigerant between the liquid and vapor states. At any point between the two lines, the refrigerant has the form of a mixture of liquid and vapor.
As seen in the previous figure, the point of union between the saturated liquid line and the saturated steam line is called "critical point". The temperature and pressure at this point are referred to respectively as "critical temperature" and "critical pressure".
Critical Temperature.
The critical temperature of a gas is the highest temperature at which said gas can be condensed by application of pressure. The critical temperature differs according to the types of gases.

Dry Steam Lines.
The phase change from liquid to vapor occurs progressively from the left to the right while the phase change from vapor to liquid occurs from right to left.
The mixture of liquid and vapor near the saturated liquid line is almost pure liquid. On the contrary, the mixture of liquid and vapor near the saturated vapor line is almost pure vapor.
The "dry steam" lines that extend from the critical point to the bottom through the central section of the table and approximately parallel to the saturated liquid and vapor lines indicate the percentage of vapor in the mixture. with increases of 10%.
For example, at any point in the dry steam line closest to the saturated liquid line, the dry vapor of the liquid and vapor mixture (X) is 0.1, which means that 10% (by weight) of the mixture is vapor, and 90% is liquid.

Source

Source
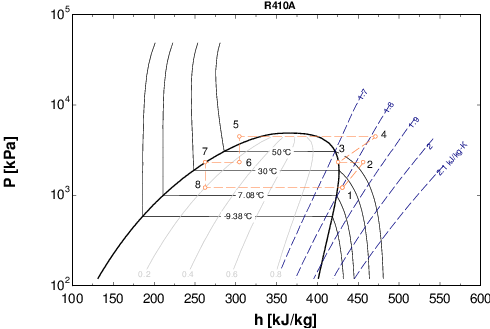
Constant Temperature Lines.
The constant temperature lines allow the reading of the coolant temperature. The constant temperature lines in the subcooled zone are generally vertical in the table and parallel to the constant enthalpy lines. In the central section, since the refrigerant changes state at a constant temperature and pressure, the constant temperature lines change direction again and fall sharply towards the bottom of the table in the superheated steam zone.
Source
Constant Specific Volume Lines.
The reading of the lines of the constant specific volume provides the "specific volume" of the refrigerant. The curved but almost horizontal lines that cross the area of superheated steam are the lines of constant specific volume.
The specific volume of a matter is the volume occupied by a mass of one kilogram of said matter and is expressed in cubic meters per kilogram (m3 fkg).
Source
Constant Entropy Lines.
The reading of the constant entropy lines provides the entropy of the refrigerant. The curved lines diagonally crossing the reheated steam zone are the constant entropy lines.
The entropy of a given mass of matter in any specific condition in an expression of the total heat transferred to matter by absolute temperature degree to bring said matter into this condition from an initial condition considered zero to zero. entropy
The point of the Mollier table which represents the condition of the refrigerant in any particular thermodynamic state can be found if two properties of the refrigerant in this state are known. Once the state point in the table is located, the table allows determining directly all the properties of the refrigerant corresponding to this state.
Source
Transformation of the Mollier Diagram to the Psychrometric Chart.
Basically, all you have to do flip it and then turn it 90 degrees.

Source
References:
- https://www.chartvalley.com/enthalpy-chart-r134a/
- https://www.engineeringtoolbox.com/mollier-psychrometric-chart-d_241.html
- http://www.thermopedia.com/es/content/966/
- http://web.mit.edu/10.213/oldpages/f99/diagrams/preenth/index.html
- Introduction to Modern Thermodynamics, Dilip Kondepudi.
- Thermodynamics: An Engineering Approach, Yunus A. Çengel.

Being A SteemStem Member
Awesome post I really think that mollier was a revolutionary.
Yes, he was
Wow great post, it was awesome the way that you explain how to read the diagram.
I'm glad yo like it
Wow, a very good article. I am currently teaching Thermodynamics to my students. This diagram is perfect for me to teach to my students. Thank you for sharing this amazing article.
Great, I'm glad you find this usefull
Congratulations! This post has been upvoted from the communal account, @minnowsupport, by josalarcon2 from the Minnow Support Project. It's a witness project run by aggroed, ausbitbank, teamsteem, theprophet0, someguy123, neoxian, followbtcnews, and netuoso. The goal is to help Steemit grow by supporting Minnows. Please find us at the Peace, Abundance, and Liberty Network (PALnet) Discord Channel. It's a completely public and open space to all members of the Steemit community who voluntarily choose to be there.
If you would like to delegate to the Minnow Support Project you can do so by clicking on the following links: 50SP, 100SP, 250SP, 500SP, 1000SP, 5000SP.
Be sure to leave at least 50SP undelegated on your account.