You are viewing a single comment's thread from:
RE: A Chat With A Top Steem Trader…….. Steemians Speak - Has Steemit Met Your Expectation?....... This Week On Steemit…….. SteemMag – Steemit’s Weekend Digest #25 p.2
Someone buying is not enough to determine if a market is in accumulation mode.
Someone is always buying and selling, its the balance that matters; whether those buyers are lifting the offer or being hit on the bid and the volume.
The market is clearly in distribution mode not accumulation mode. As the negative Accumulation/Distribution indicator shows below. Along with the fact that the indicator is trending down with price. If it were trending up with price remaining the same then the market could be said to be in accumulation mode. It isn't.
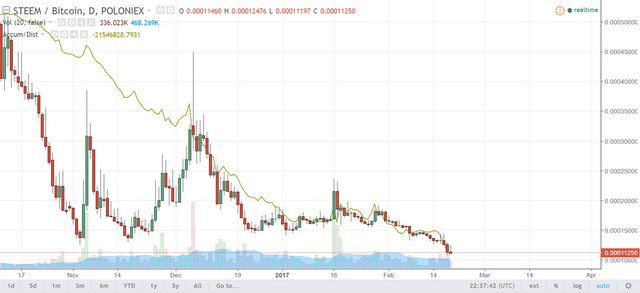
https://postimg.org/image/icy74zhm7/
My comment about the coins was uncalled for, I apologize for that.
Your definition of accumulation and distribution are different from mine.
I would also suggest that you zoom out to the full chart instead of looking at such small time frame as you miss the bigger picture.
I consider accumulation when a token has been in a price range for a long period of time. This range is completely determined by what time frame and how big of a timeline you use when you zoom out on the chart.
Even on that chart you posted, you'll see that on every mini-rise (circa early november, mid december and mid january), there was volume associated to it.
These are small volume indicators that show higher amounts of BUYING than normal (since they really are all associated to price moves up. Don't let the December red volume marker fool you in the image you posted, it's just the time in which that candle was painted.)
These larger than normal volume days are an indication of activity and help to confirm the accumulation mode the token is in.
Here's a chart that clearly shows the pattern that I mean.
The narrow band is highlighted with some blue and purpleish lines to indicate the range. This where the price has been for the last several months.
Notice the volume indicators that mark as confirmations of this chart pattern.
Also, observe that the majority of the price has been closer to the support level of that narrow band.
Indeed, you can see the same type of phenomena in many other charts, i.e. narrow trading band for a period of several months (or even longer) with various candles strewn about that have larger than normal volume which are almost always paired with a rise in the price.
To me, this is a chart that has all the hallmarks of a cryptotoken that is in 'accumulation' mode.
I agree with looking at the entire picture and seeing the context of an extended downtrend followed by a ranging period where volume spikes. This is a pattern for accumulation as you've stated. We however have to take into account accumulation indicators, which are a derived from price and volume.
However just because the pattern makes sense doesn't mean it's 'technically' accumulation we're seeing. Like I said above, overall volumes and changes in volume have to be taken into account.
My value for the Accumulation/Distribution indicator may be over exaggerated due to the rise in the price of BTC - however I think it's still loosely accurate.
We might be close to some kind of accumulation, but I don't think the market is quite ready. It's one thing to notice the pattern and a few spikes in volume, it's another to actually call that accumulation. Also we need to take into account the implications of HF16 on the ranging period.
I think this article provides a little more context above and beyond the pattern.
http://www.investopedia.com/articles/trading/08/institutional-effect.asp
Due to nested comment limitations, putting this here.
I don't use other people's created tools for indicators.
Yes, we're still on lower volume, but the supply availability on the order books is not available for accumulating directly from taking away from the ask side.
This is due to the illiquid nature of all cryptotokens.
As such, low volume in a 'narrow' range is an indicator because you can't apply all of the other TA from stocks to trading cryptotokens.
In addition, I don't bother with looking at how btc rises in comparison to fiat. It's a simpler analysis to only consider btc to alt ratio. As rising or sinking btc is correlated to alt price in fiat (or near enough, i.e. btc rises 15%, an alt may go down immediately 25%, but tends to recover to maybe 10% lower than it was -- assuming btc was stable during the adjustment).
Plus, nearly all gateways are btc to alt anyway, so why would anyone consider any pricing from alt to fiat?
You don't want to call accumulation, that's fine. However, I am, as I don't believe your indicator, for reasons outlined above.