Steem Statistic Charts Week 13 --- Including Country Statistics
While Steemit's figures look very disastrous, I would first like to highlight something positive. Although the price fell back to the December level, we have twice as many total accounts, active users and daily unique visitors and a 60% increase in activity since then. In terms of fundamental figures, Steem is significantly undervalued compared to December.
In week 13 of 2018, price of Steem decreased by 33.2% while the SBD price decreased by 31,0%. Activity key figures and daily unique vistors have dropped and the total number of accounts has risen only slightly.
Inflation Rates
Steem: 8.93% per year
SBD: 2.18% per week
All-In-One-Chart
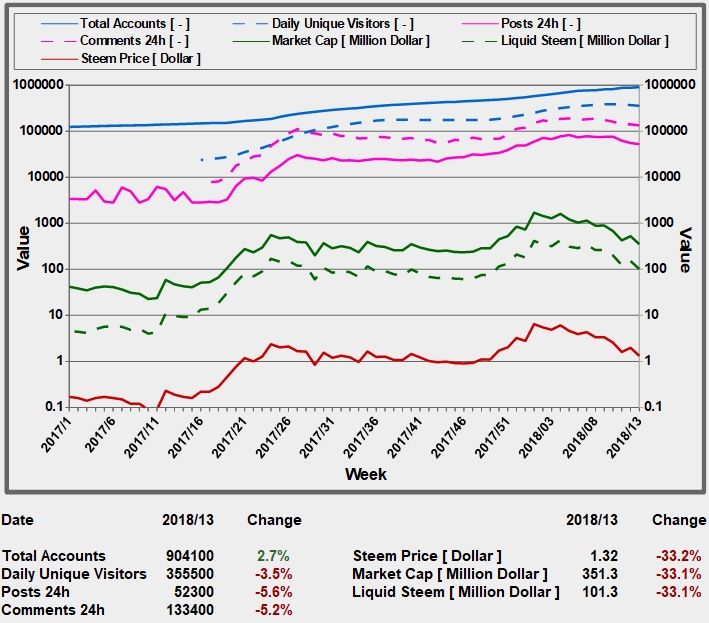
The all-in-one-chart shows all activity values and monetary values in a logarithmic scaling where you can see the correlation between the curves.
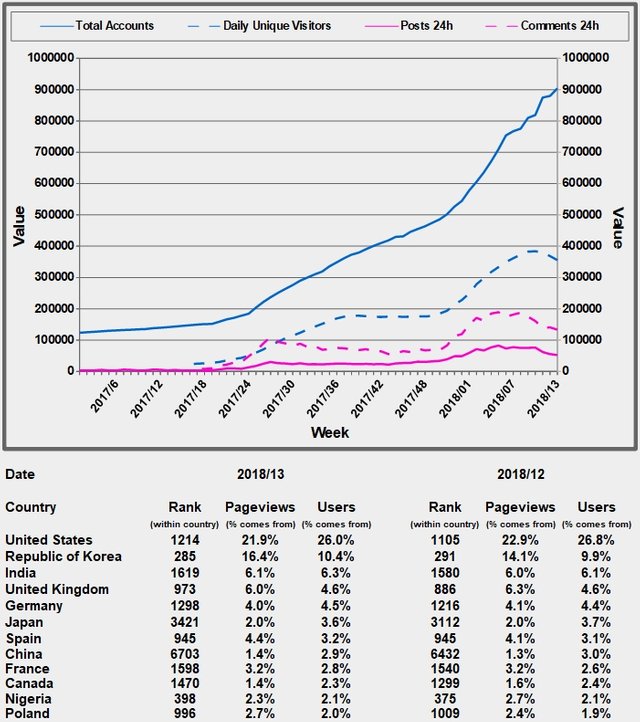
Acivity Chart and Country Statistics
This Chart shows the activity numbers of Steem in a linear scaling. Below the diagram is the top 12 country statistics with country ranking and the share of countries in page views and users. Next week I will extend the country statistics from top 12 to top 24.
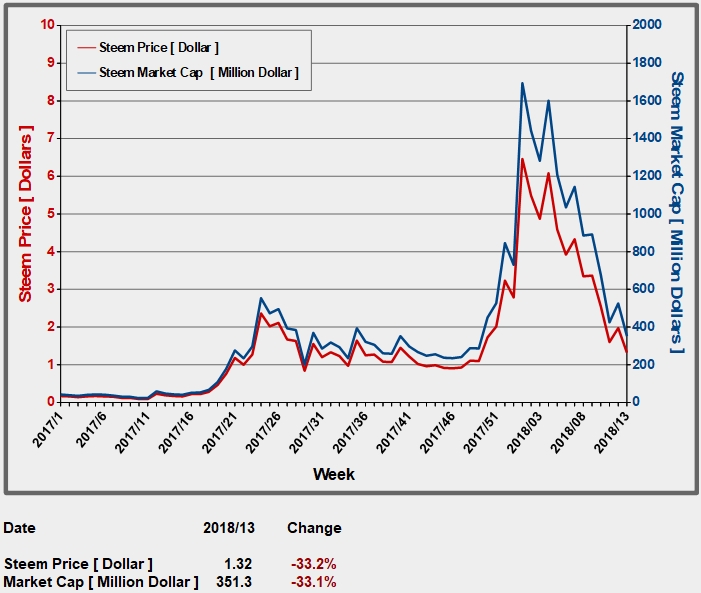
Steem Price Chart
The following chart shows the steem price and market capitalization in a linear scaling.
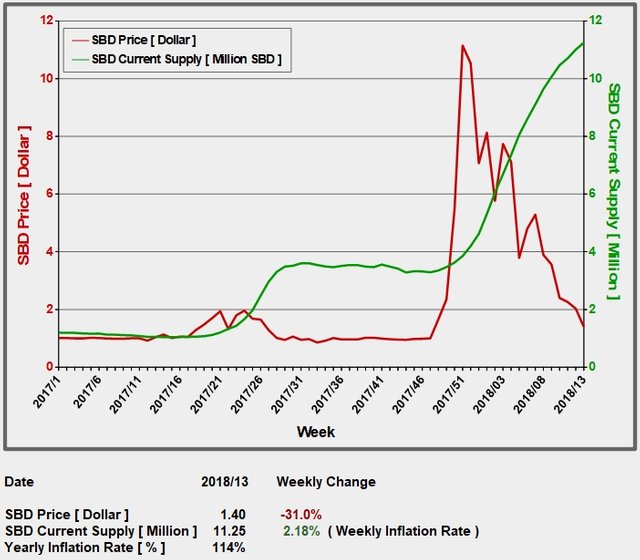
SBD Chart
The following chart shows the SBD price and SBD supply in linear scaling. The inflation rate of SBD is now 2.2% per week.
My goal is to offer the best statistics on Steemit, which are presented in a way that everyone can understand. So don't hesitate to give me advice for improvements.
Here are the links to my last five weekly statistics:
https://steemit.com/steemit/@sevenseals/steem-statistic-charts-week-12-including-country-statistics
https://steemit.com/steemit/@sevenseals/steem-statistic-charts-week-11-including-country-statistics
https://steemit.com/steemit/@sevenseals/steem-statistic-charts-week-10-including-country-statistics
https://steemit.com/steemit/@sevenseals/steem-statistic-charts-week-09-including-country-statistics
https://steemit.com/steemit/@sevenseals/steem-statistic-charts-week-08-including-country-statistics
----------- Comments will be voted. -----------!
Amazing statistical analysis as always.
Thanks for considering my proposal.
I'm happy to reading this comment:
Good luck @sevenseals
It's nice that there are people who read the text and also perceive changes. ^^
Maybe it's because I always look up to this Stats but then I always read posts that catch my attention and try to participate by upvoting and commenting if I find it necessary to do so. I think this is how it should be on Steemit rather than commenting like bots.
I wonder where all these dozens of votes come from with zero value.
You are getting bullied on steemnova. Maybe switch alliances to get better protection? Would you be willing to join logic force? Thanks!
Great stats to look at and contemplate. Overall positive trends on accounts and views. I would have thought these would have come down given the recent declines from the overall market. Although, I personally see myself more time on #Steemit now to get the news than elsewhere. Another positive is that the country list is becoming somewhat more diversified from the US which is also good. Thanks for the information!