Positive or Negative? The Data behind the Steemit Trending Page - Steemit Business Intelligence
Do you want to get your post on the Steemit trending page? Well so does every author here on Steemit and the competition is high. A couple of months ago I created a post How to get a post on Steemit Trending - What the data tells us
https://steemit.com/steemit/@paulag/how-to-get-a-post-on-steemit-trending-what-the-data-tells-us
And, I was surprised with the findings. At the time I was relatively new to Steemit and it came of a surprise to me that the value of the post, along with the age of the post, were the key factors in getting your post to trend.
In essence you need to get high value votes within the first 24 hours of posting to get your post onto the trending page.
It was also evident that there were a number of Authors that had numerous posts on the trending page. At the time, from observation of the trending page, these same authors came up time and time again.
Now I am a little more experience on Steemit. I have a much better understanding of the mechanics, operations and politics involved on the platform. There are now new whales on the scene and by observation I have noticed new names on the trending pages. But I have also noticed by observation that the pay-out value seems to be less and so does the vote counts.
Based on these observations, and equipped with the knowledge I now have about Steemit, I have decided to have a look at this analysis again. The aim is to establish how much pay-outs and voting activity has changed since august. Also to see who and what trends, and how the posts make it to the trending page.
The analysis
This is one of the more complicated analysis that I have carried out on steemit data. The first steps involved scraping the data from https://steemit.com/trending. I have scraped details for 138 posts on the 15 October as at 15:00 GMT.
Once I scrapped the data, there was a lot of work to transform the data into a usable and meaningful format. I also needed to merge the data with data held in the steemsql database held by @acangre. For this I needed data from the txvotes table but to link the data I also needed the comments table. The third set of data came from https://steemwhales.com
This is one of the most complicated analysis I have carried out on Steemit data. There were a lot of transformations and mash ups needed. If there is an interest in how I have done all of this, I can put it in a separate post, so comment below and tell me if you want to see how this is done. Including all of the details here in this post, would only take away from the story the data has to tell.
The Basic Data
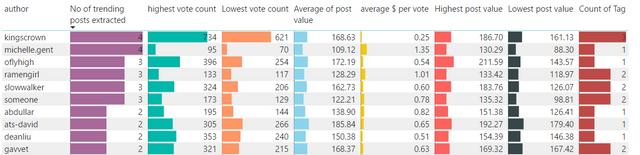
Authors and No. of Posts
There are 112 authors with posts on the trending page. 20% of the posts are made up from 9% of these authors. As with my analysis carried out in August. Authors that trend, tend to trend over and over. Here are the 10 authors that make up 20% of the posts on trending.
Vote Count
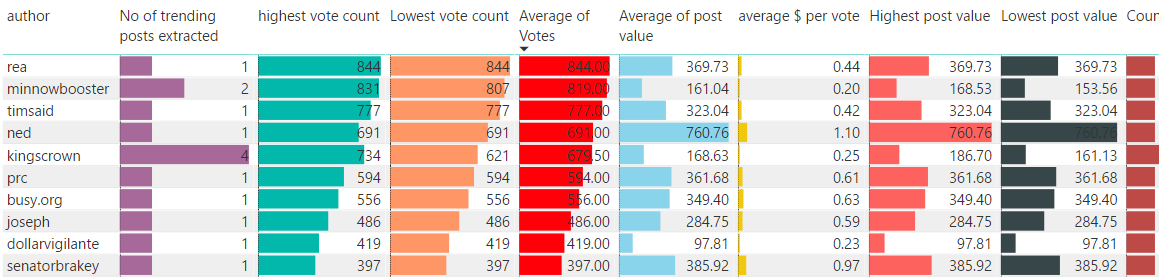
Looking at the data sorted by highest vote count. Highest vote count find the post on trending by the specified author and returns the vote count for the post with the highest number of votes. (Lowest vote count works the same but returns the vote count for the post with the lowest number of votes)
The number of votes for posts on the trending page ranges from only 7 to 844. This is considerably different to that of the August report where the highest vote count was 3678 and there were 4 authors that received well over 1k votes per post on the trending page.
On average posts on the trending page now have 194 votes where as in August this value was 268. That’s down 28%
Minnowbooster for example is down 77% on the average number of votes per post since Aug and @Kingscrown is down 19%. @dollarvigilante is also down 20%. These are the only 3 authors that are in the list below that were also in the top list based on average no of votes in August.
Here are the top ten authors based on average number of votes per post on the trending page.
Payments
The average post payment for posts on the trending page is $140 with the highest earning post making $760 and the lowest making $55. In august the average post payment on the trending page was $161, the highest being $840 and lowest is $55.
Looks like the lower boundary of $55 has held for post on trending. However the average pay-out value of posts on trending is down 13%.
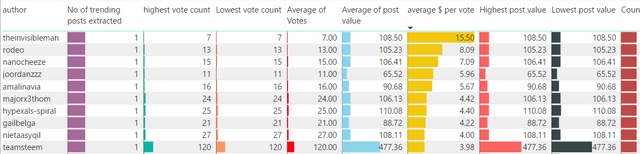
Finally if we sort the same table of data by average $ per vote. In August the average value of a vote received for a post on the trending page was $0.60. This value has now risen to $0.72
Here are the top ten authors based on the average value per vote received on their post that trended. @theinvisibleman received a whopping average of $15.50 per vote. Okay there were only 7 votes, so right now, I can only assume these votes were from whales.
Comparison with Posts Benchmarking report
Each month I prepare a Posts benchmarking report, if you have not seen it, the September report is available here
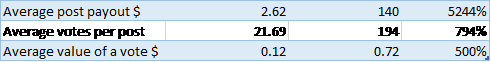
Taking from the September report, the average post on Steemit only earns $2.62. The average number of votes per post was 21.69 and the average value of a vote is $0.12.
That means to get a post on the trending page, all of the stats must be well above average. Just look at the table below to see the comparisons
Other Changes
The price of STEEM has dropped since August. When I carried out the first report on posts on the trending page, the price of STEEM was $1.24. At the moment the price of STEEM is $1.02. That’s a 17% drop in the price of STEEM.
The number of new users registered in Sept dropped by 19% on August.
Summary So Far
Securing a place on the trending page of Steemit is extremely difficulty. The gap between stats for the average post on Steemit and posts on the trending page are massive. However if you do trend, you have a higher probability of trending again.
The price of STEEM has dropped by 17% however the average pay-out value of a post on trending is down only 13%. This difference can be offset against the increase in the average value of a vote from $0.60 to $.72 (20%) and the decrease in the average number of votes per post of 28%
The drop in average number of votes is higher than the drop in new users in September. This suggestions a drop in retention, which we have looked at in a different article.
The increase in the average value of a vote for posts on the trending page could be explained by the growth in SP of accounts voting since Aug to now. July and Aug were big big months for new Steemains. These accounts had little SP in Aug and their votes were not worth much, but as these accounts have grown, so has the value of the vote.
Another explanation is down to who votes for these posts, are more whales now voting for posts or voting at a higher weight or value?
What do you think of this analysis so far? are the finding positive or negative? What are your takeaways? Comment below and let me know
Part 2
In this second part of this analysis we will continue to analyse the posts on the trending page. We will look at categories used, who is voting for posts on the trending page, and we will also look at how the top 250 whales on steemit vote for posts on the trending page.
I am part of a Steemit Business Intelligence community. We all post under the tag #BIsteemit. If you have an analysis you would like carried out on Steemit data, please do contact me or any of the #bisteemit team and we will do our best to help you...
Excellent post! I do appreciate the time and effort you put into transforming the data and providing your analysis. I look forward to your future posts and analysis.
Have a great week!
Steem on,
Mike
thanks mike
I hope you and your loved ones got through storm Ophelia alright.
Take care and stay safe,
Mike
Thanks for the write up. Thise are good points to take into consideration when posting.
Thank you for doing all this research. I am a numbers junkie.
I am curious if you see the influence/power of the whales increasing or decreasing as time goes by? It appears that the ability to circle upvote is definitely in play at times. With newer people coming into the system, is that starting to crack a bit?
I do not know if you have that data at your disposal but what is your gut telling you?
Thanks.
Thank you for extracting this data. Now I have a better idea on what it takes for a post to make it into the trending page.
One of the key take-away is this:
And another thing that caught my eye, these trending posts only included one to three tags.
I'm looking forward to the next analysis as to which categories trend best.
P.S.
Some minor grammatical correction if you may:
to extremely difficult.
This post has received a 1.56 % upvote from @drotto thanks to: @banjo.
Paula, I would definitely be interested in knowing how you transformed the data to accomplish this analysis. The more down and dirty that you could get with the details the better in my opinion. And of course as a Power BI user, I'd be very interested in any Power BI specific details you'd offer up.
Congratulations! This post has been upvoted from the communal account, @minnowsupport, by paulag from the Minnow Support Project. It's a witness project run by aggroed, ausbitbank, teamsteem, theprophet0, someguy123, neoxian, followbtcnews/crimsonclad, and netuoso. The goal is to help Steemit grow by supporting Minnows and creating a social network. Please find us in the Peace, Abundance, and Liberty Network (PALnet) Discord Channel. It's a completely public and open space to all members of the Steemit community who voluntarily choose to be there.
Hi Paula
While the trending pages are out of reach for many of us, they do provide interest when the stats are gathered and presented each month or so.
My main take out is the 28% drop in votes. It's not affect the payouts in trending so much, but I suspect for other blogs it will have.
A 3 tag average is interesting - I may cut mine and see what happens.
Great work!
glad you liked the post. 28% in votes is rather substantial
This post was resteemed by @steemitrobot!
Good Luck!
The @steemitrobot users are a small but growing community.
Check out the other resteemed posts in steemitrobot's feed.
Some of them are truly great. Please upvote this comment for helping me grow.
you are a good writer..