Steem Ed: How to Create Candlestick Charts
In #investing analysis, candlestick charts are an immeasurably useful tool. Unlike line charts, candlesticks provide the open, highs and lows of the session, and the close. Invented by Japanese merchants long ago, they're still incredibly useful in the modern age.
Today, I'm going to show you how to create candlesticks in Microsoft Excel, and then we'll go over some basic analytical concepts.
First, go to Coinmarketcap.com and copy the data from a #cryptocurrency of your choice. In this case, I used DigiByte (DGB).
Next, paste the data into cell A1 in a new Excel spreadsheet
Insert a new column in column B, then cut column G, "Volume," and paste into column B, as shown below:
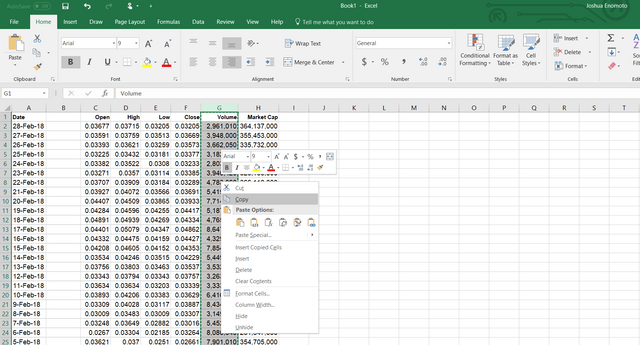
Delete Column G to bring all the columns together.
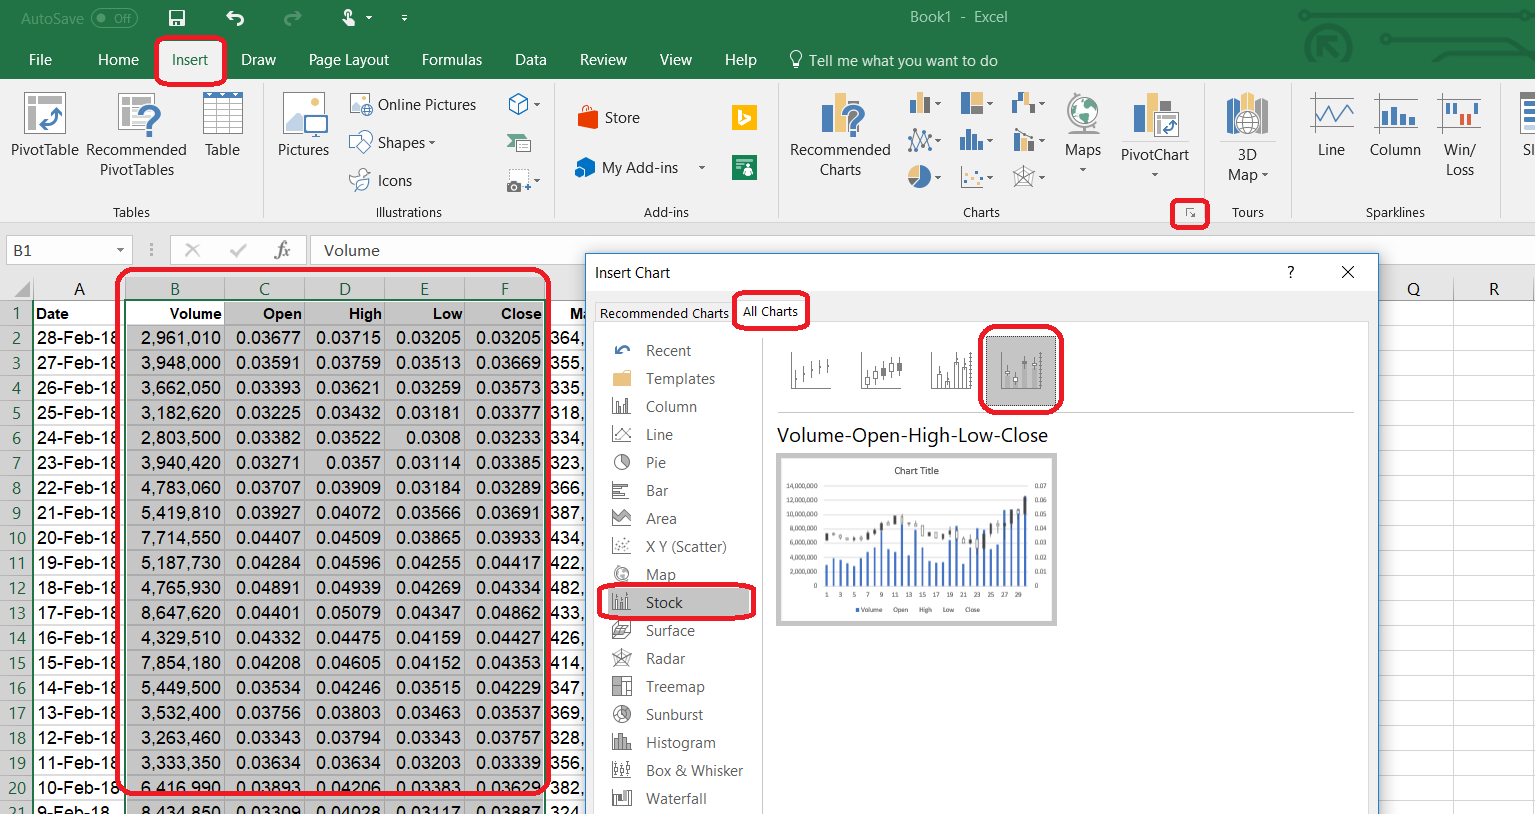
Next, select (highlight) all of columns B through F, click Insert at the top menu, click the arrow icon next to charts (to the right), click "All Charts," then click "Stock," and finally, select "Volume-Open-High-Low-Close." Please review the below pic for further clarification:
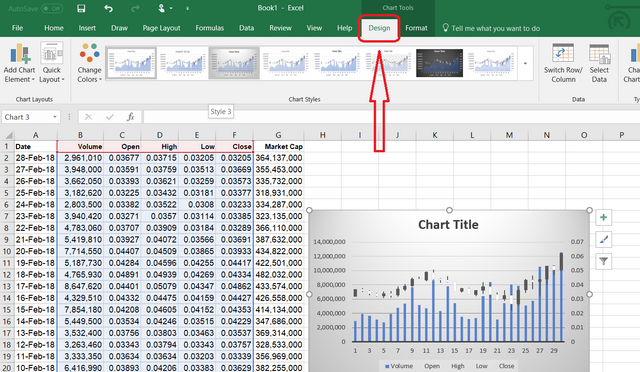
- After you click okay, you should see your new candlestick chart! On the "Design" menu, you have multiple styling options to "beautify" your candlestick chart. See below pic:
Important Edit...!!!
I forgot to include how to include "date" information for your chart! Please see my post here, which explains everything! -- https://steemit.com/education/@bullishmoney/one-critical-steem-ed-lesson-i-forgot-to-include-in-my-last-post-please-read
Let's talk some basic analysis:
This self-explanatory picture explains the fundamental anatomy of the candlestick:
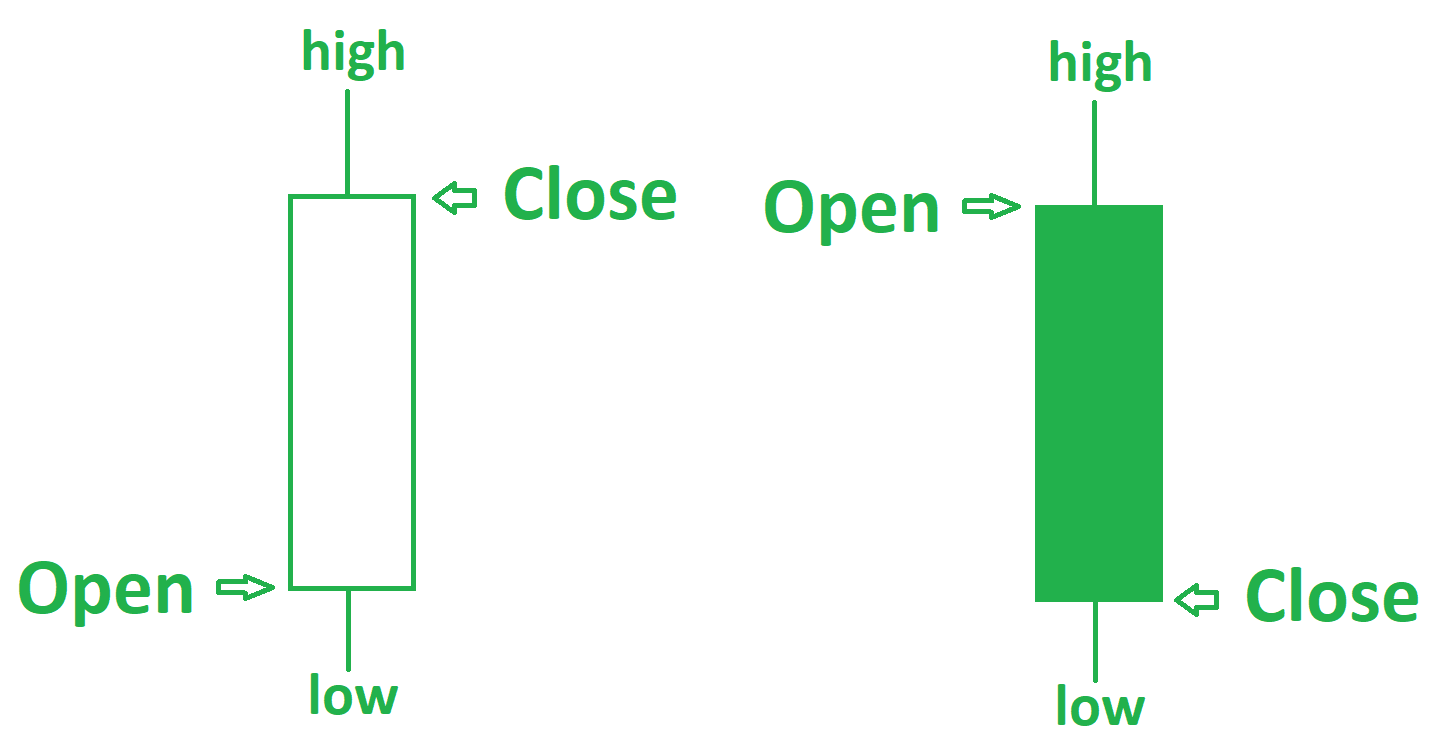
The difference here is that when a candlestick body is white, the open starts at the bottom, and the close ends at the top. When the candlestick body is filled in, the open starts at the top, and the close ends at the bottom.
The best way to remember this (and this is by no means racial) is "white is right, black is whack." In black-and-white printing, technical analysis books would feature white candlestick bodies to signify bullishness, and filled in black candlestick bodies to signify bearishness.
Generally speaking, as a long investor, you want to see robust, white candlestick bodies -- that signifies bullish sentiment participating in the markets. You can also verify this with the volume trends -- as price goes higher, the volume should confirm (ie. move higher as well).
There's an entire body of work dedicated to candlestick analysis!
However, at this moment in time, I'm not going to get into it because it would require a significant investment of my time, and typically, my posts only get 70 cents a pop.
I'm sure you will agree that my ongoing contributions to Steemit are worth more than 70 cents! :) Of course, if I can get some sort of "crowdfunding" going on, I'd be more than happy to dedicate an entire series to candlestick analysis as it is a very fascinating and profitable discipline.
In my next post, I will get into more details on how to use Excel as a powerful trading tool! Please stay tuned!
Thank you for visiting my Steem Ed series! Any upvotes or resteems are highly appreciated as they support my independent work to educate all Steemians on market analysis and investing!! :)
For more examples of my work, please see the following:
- TipRanks profile -- https://www.tipranks.com/bloggers/josh-enomoto
- InvestorPlace profile -- https://investorplace.com/author/joshenomoto/#.WpHykKjwZPY
- Crush The Street profile -- https://crushthestreet.com/about-joshua-enomoto
- Future Money Trends profile -- https://www.futuremoneytrends.com/about-us
- Market Mavens profile -- http://www.marketmavens.com/author/jenomoto/
- Muck Rack profile -- https://muckrack.com/josh-enomoto
- TipRanks "Top Blogger" featured profile
- Kiplinger feature article
- Nasdaq feature article
- MSN Money feature article
- Yahoo Finance feature article
- Financial Survival Network with Kerry Lutz feature
- Citizens For Trump political activism
- The Daily Coin feature article
- Before Its News linked article
- Duane Morris LLP expert reference
- Scutify feature article
- Trading.co.uk featured link to my Top Blogger profile
- ETF Trading Research feature article
- Commodity Trading Research feature article
- Daily Trade Alert expert reference
- Bitcoin Newswire feature article
- Minyanville feature article
- Family Council expert reference
- Radio host James L. Paris Christian Money expert reference
- Korean Community of San Francisco feature article
- Wealth Insider Alert feature article
What a brilliant post. Clearly explained, and easy to follow. Excel has always been a bit of a love/hate relationship for me. I love what it does, but hate that I tend to make it do the wrong thing aha!
Thank you so much for the compliments! I did forget to include one component, how to include the date, which I updated in my latest post here -- https://steemit.com/education/@bullishmoney/one-critical-steem-ed-lesson-i-forgot-to-include-in-my-last-post-please-read
hello
Now even my nephews and nieces can follow step by step @bullishmoney
Resteem...and Promoted
https://steemit.com/promoted/investing
Thanks so much Frank! I want to mention that I forgot to include the date component of the chart education, which I included in my last post -- https://steemit.com/education/@bullishmoney/one-critical-steem-ed-lesson-i-forgot-to-include-in-my-last-post-please-read
Definitely don't want to leave your nephews and nieces hanging! :)