Steem Price Update and Technical Analysis
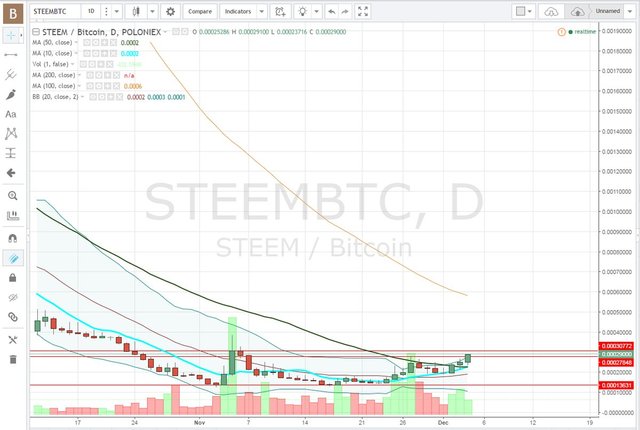
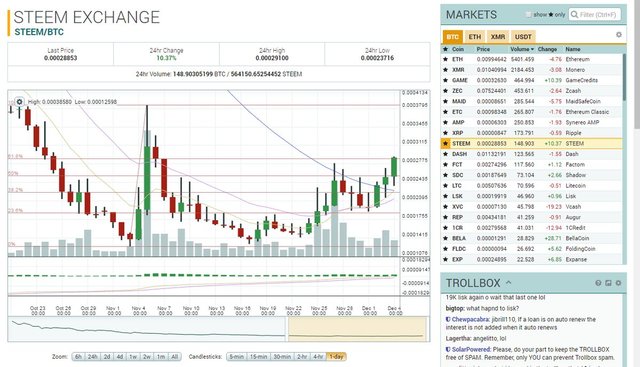
Below, is the daily and Monthly chart on STEEM. We are in a bullish uptrend. On the daily chart you can see we finally closed above the 50 day moving average. We also have positive MACD convergence and a breakthrough of the zero line.
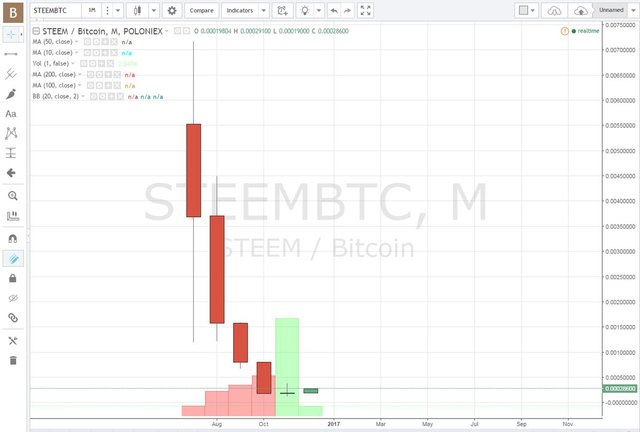
The Monthly chart is showing a very positive reversal trend. This is the second Month in a row with bullish buying volume.
The next level or resistance is around 31k Satoshi's , and we should have no problem moving higher.
In my opinion I believe we can see a steady rise in the price of STEEM for the Months ahead of us.


It's suggested that there will be a limiting of the supply, that surely will have an increase in the price.