RE: Steem statistics for 6 years
Between March 2021 and May 2022, activity was consistently higher than later (for authors, posts, and commenters). At that time, the Steem price was already slightly higher than afterwards. I would cautiously see an influence after all. As far as I could determine from @remlaps-lite's statistics posts, printing of the SBD was stopped in May 2022. Indirectly, the reduction in activity is therefore related to the Steem price.
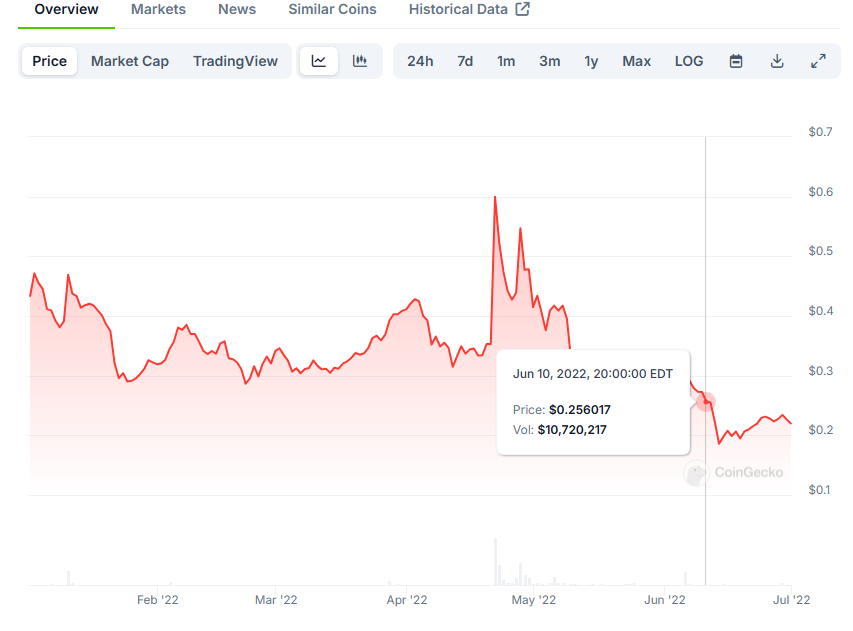
Unfortunately, that data came from steemdb, so it's long gone now unless someone wants to scan the blockchain or hivemind for author reward transactions. But I think it looks like SBDs stopped briefly in May, then started again and stopped again in June (or the very end of May). I'm pretty sure that the print threshold was around $0.252 back then, so based on the price history, I guess they stopped printing in early-mid June.
Past research also found a link between posting activity and the price of STEEM. In particular, they said that posting activity lagged price by about 2 weeks and voting lagged by 90 days (I'll bet that changed to 30 days when the power-down rules changed).
The peak in new accounts in May 2020 is remarkable. Is this coincidentally at the time of HF 0.23?
I had skimmed over that earlier, but it is fascinating. There was a lot of antisocial and other atypical behavior going on between March and May that year. I'd suspect malfeasance - my guess would be that it was someone trying to strain steemit's resources or setting up a bot farm.
Update: And this had slipped my mind, but I found it again when I was looking for the article above. Maybe useful for some historical data:
We collect over 38 million blocks generated in Steemit during a 45 month time period from 2016/03 to 2019/11 and extract ten key types of operations performed by the users. The results generate SteemOps, a new dataset that organizes over 900 million operations from Steemit into three sub-datasets:
Yes, that's exactly why I expected more influence on the activities at this time. The fact that a few more accounts were created there is the lesser evil.
I also used your burned token posts for the estimation. :-)
Too bad that we didn't have the data saved somewhere. But it's not worth running the chain because of that.
I have discovered an alternative (paid rewards). I looked at an account that posts daily (nodex).
With this query and the appropriate times, we can determine the reward shares (and thus also the print rate): https://sds0.steemworld.org/rewards_api/getRewards/author_reward/upvu.proxy/1598918400-1656633600
I couldn't find a better graphic in a hurry. :-)
As you can see, there were fluctuations in the print rate at the end of 2020, but after that it was fairly stable until May 2022.
Have you downloaded the data? I'm a little hesitant because I don't know how large the amount of data is.
No, I haven't downloaded it. I also don't know how big it is, but I was assuming that I don't have enough storage available to do anything useful with it.