July and August ‘18 Steemit Post Bench-Marking Report - Blockchain Business Intelligence
Repository
https://github.com/steemit/steem
Every month I was producing a Post bench-marking report with the aims of:
• Aiding the Steemit Community with a place to benchmark their posts and growth
• Create a report that can be used for comparisons in other periods
• To track my personal targets and record achievements
Over the last few months I have added new data to this report, including comparisons to the same period last year, top earn authors and authors with the highest number of votes. I have also added details of flags and I have added more statistical calculations to the mix, as per requests :-)
Please note this data is based on Posts and not Comments.
I missed the report last month so both July and August results are included in this post. I am wondering, do you this this report provides more value of it is done every month or every second month? Please do leave your feedback below.
July 18
Financial Performance
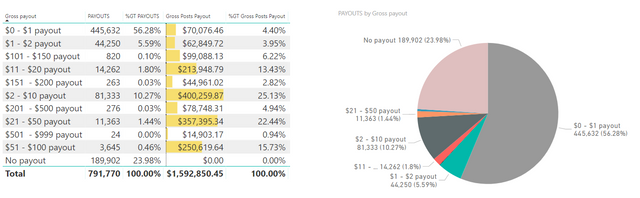
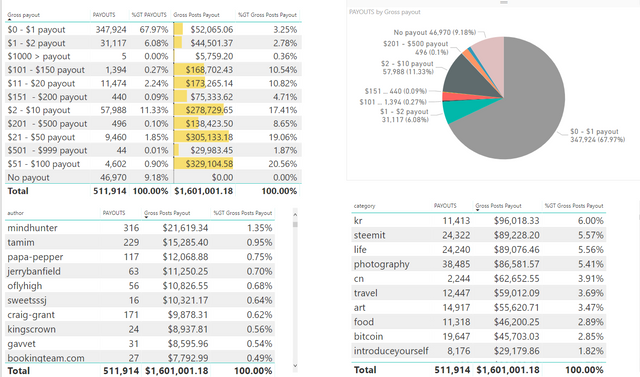
In July 18 the % of posts with no payout was almost 24%, up from 21% in June.
The % of posts with a payout of <$1is down from over 59% in June to a little over 56%
The number of posts with a payout of over $500 is down from 54 to 24
The average post pay-out value in July was $2.01 June was $2.08, May ’18 was $2.73. In April ’18 was $3.18. In March it was $1.76 SBD, $2.56 SBD in Feb and $3.81 SBD in Jan. If we exclude posts with no pay-out the average post pay-out increases to $2.64 SBD. In June the average post pay-out excluding post with no pay-out was $2.62 SBD.
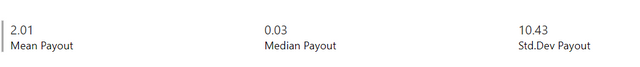
The median payout value was $0.03 with a standard deviation of 10.43
The number of posts decreased from June 18 to July 18 by 11%, and the pay-out value decreased by 14% for the same period.
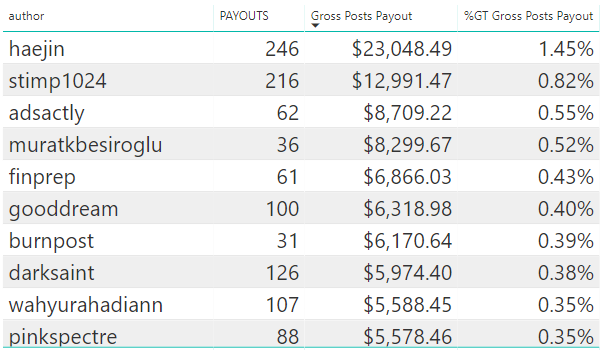
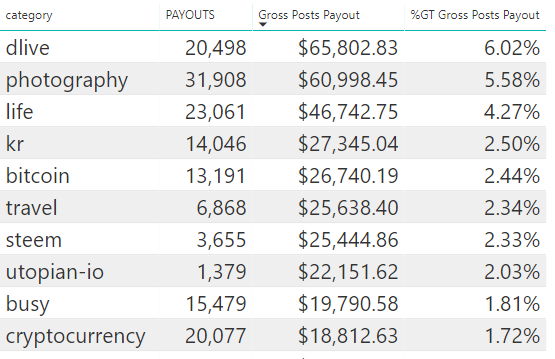
Top Authors based on Gross post payouts
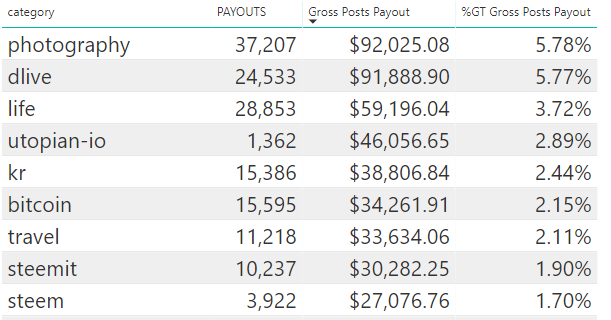
Top Category
2017
To get a quick comparison to the same time last year, here is last years report for July
We can see from this posts are up over 31% on the same time last year but the SBD value of the payments is down 32%. The stats for aug last year were:

Comments
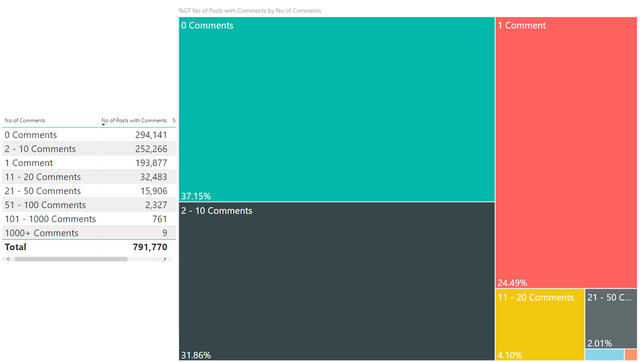
The % of posts with no comments is up from 34.29% in June to 37.15% in July.
The mean number of comments per post is 3.05, the median is 1 and the standard deviation is 11.3

Votes
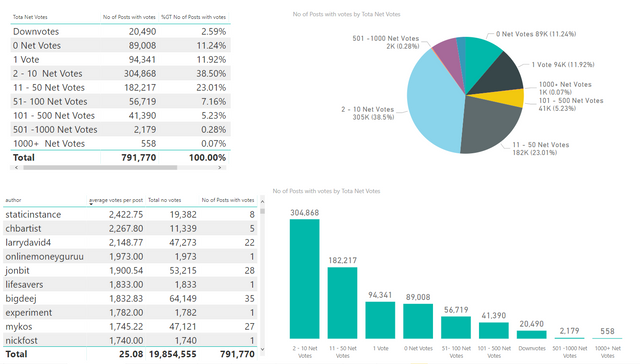

The % of posts with 0 net votes has increased from 10.02% in June to 11.24% in July. The median votes per post was 5 with a standard deviation of 72.89.
Flags
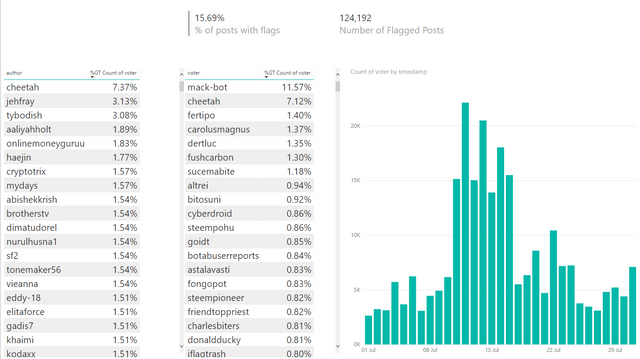
In votes above we also have flags, however combined only1.27% of posts had a net downvote. This is up from 0.82% the previous month.
124K posts received 1 or more flags( this is posts not comments). This makes up 15.69% of all posts made. This is up from 10.26% the previous month.
In the first table we can see the authors with the highest % of flags and after this the table shows who gave the most flags. Following this we can see the time series for when flags were given
Other Data
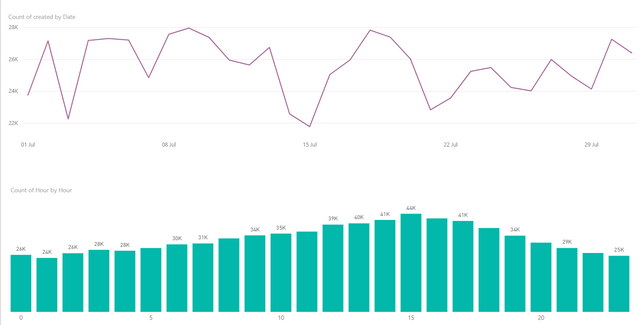
The line chart above represents the number of new posts per day in July 18 and the bar chart below that shows the peak posting hours.
August 19
Financial Performance
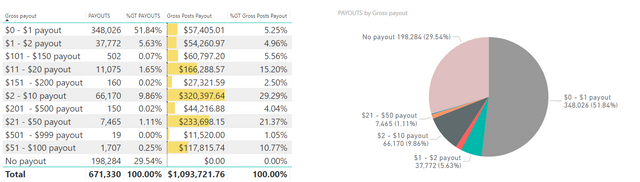
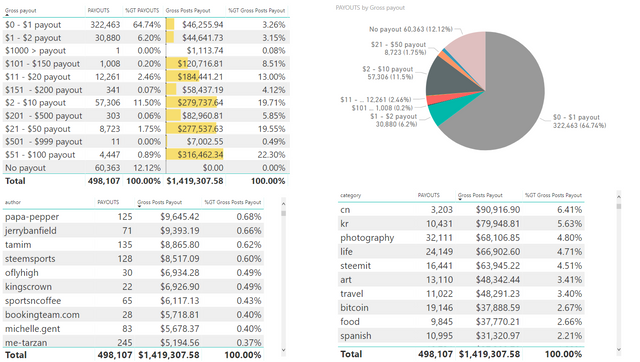
In August 18 the % of posts with no payout was just over 29%, up from 24% in July.
The % of posts with a payout of <$1is down from over 56% in July to a little under 26%
The number of posts with a payout of over $500 is down from 24 to 19
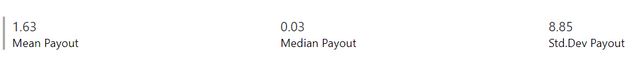
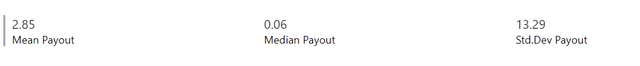
The average post pay-out value in August was $1.63. In July this was $2.01, June was $2.08, May ’18 was $2.73. In April ’18 was $3.18. In March it was $1.76 SBD, $2.56 SBD in Feb and $3.81 SBD in Jan. If we exclude posts with no pay-out the average post pay-out increases to $2.64 SBD. In June the average post pay-out excluding post with no pay-out was $2.62 SBD.
The median payout value was $0.03 with a standard deviation of 8.85
The number of posts decreased from July 18 to Aug 18 by 15%, and the pay-out value decreased by 31% for the same period.
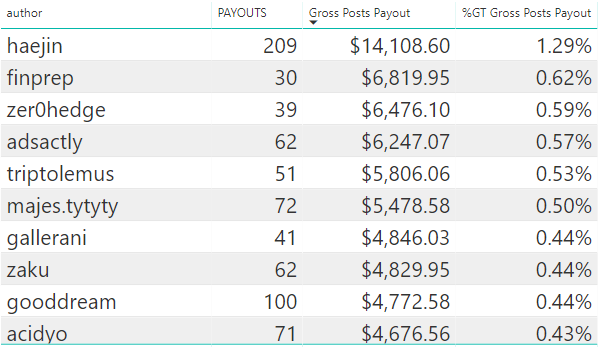
Top Authors based on Gross post payouts
Top Category
2017
To get a quick comparison to the same time last year, here is last years report for August
We can see from this posts are up over 50% on the same time last year but the SBD value of the payments is only up 12%. The stats for aug last year were:
Comments
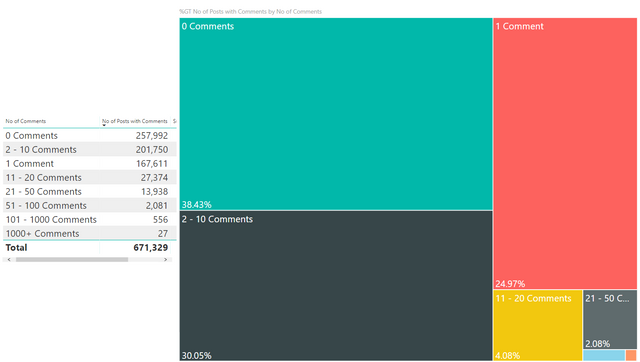

The % of posts with no comments is up from 37.15% in July to 38.43% in Aug.
The mean number of comments per post is 3.17, the median is 1 and the standard deviation is 38.47
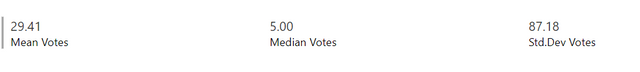
Votes
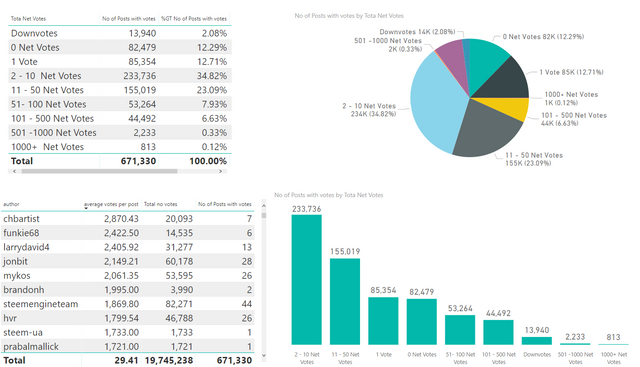
The % of posts with 0 net votes has increased from 11.24% in July to 12.29% in Aug. The median votes per post was 5 with a standard deviation of 87.18.
Flags
In votes above we also have flags, however combined only1.27% of posts had a net downvote. This is up from 0.82% the previous month.
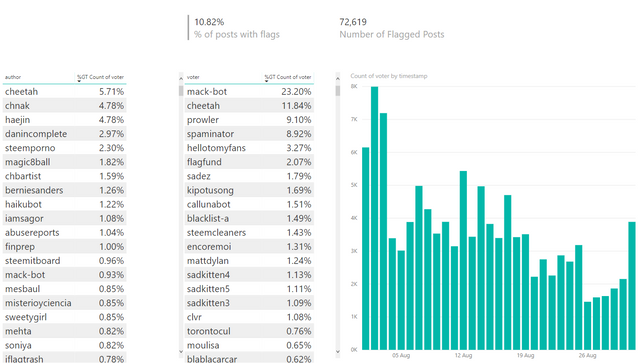
72K posts received 1 or more flags (this is posts not comments). This makes up 10.82% of all posts made. This is down from 15.69% the previous month.
In the first table we can see the authors with the highest % of flags and after this the table shows who gave the most flags. Following this we can see the time series for when flags were given
Other Data

The line chart above represents the number of new posts per day in August 18 and the bar chart below that shows the peak posting hours.
Conclusion
Post payouts have been on a downtrend for some time now. The price of SBD and STEEM have an impact on this and we are seeing a difficult year for crypto in general which is having its toll on post payouts.
The number of posts made per month has also been on a downtrend for much of this year and July and Aug are just following the trend. However if you look at the number of posts made the same time last year, there is still a substantial increase.
The median votes per post has remained consistent at 5 in July and Aug for both 2017 and 2018 however the median number of comment per post has reduced from 2 to 1.
The Data source and Query
As always I have connected to Steemsql managed by @arcange using Power BI and the query is usedfor 2018 data was
SELECT author, category, created, children, total_payout_value, net_votes, pending_payout_value FROM Comments (NOLOCK) where created >= CONVERT(DATE,'2018-07-01') and created< CONVERT(DATE,'2018-08-01') and depth = 0And 2017 query was
SELECT author, category, created, children, total_payout_value, net_votes, pending_payout_value FROM Comments (NOLOCK) where created >= CONVERT(DATE,'2017-07-01') and created< CONVERT(DATE,'2017-09-01') and depth = 0
Hi @paulag, thanks for the update! Seems like the downward trend on several metrics is still going on...
I like the monthly reports! The two separate reports, one after the other into the same post, are a bit hard to follow, though. Maybe you could combine this and include some more references to previous months? That part caught me, and I had to read it a few times to get the trend:
How about a graph across several months? This would immediately give a picture on the trends. The same could work for the number of posts, and possibly others?
I think the numbers in the flags section of one of the months got mixed up - the numbers and the text seem identical, but you describe an increase.
Is the SQL-query the exact one you used to get these results? How did you get the number of flags from this?
Your contribution has been evaluated according to Utopian policies and guidelines, as well as a predefined set of questions pertaining to the category.
To view those questions and the relevant answers related to your post, click here.
Need help? Write a ticket on https://support.utopian.io/.
Chat with us on Discord.
[utopian-moderator]
Thank you for your review, @crokkon!
So far this week you've reviewed 1 contributions. Keep up the good work!
A median payout of 0.03$ is absolutely sad 😔 I really hope that @steembasicincome and @steem-ua pays out for everybody some day... @peekbit
Well thats a hope many of us share
Posted using Partiko Android
🤞🏼😊
Thanks for this report @paulag!
I'm really stoked to see dlive contributing such a large chunk of rewards to the community! A lot more than I expected. I'd imagine most of this is gaming related, but would it be possible to see an individual breakdown of the dlive content?
Not sure if your report would allow you to drill down?
Na, this report wasnt created as a drill down. But I will look at doing a Dlive post in the next few weeks, its such as awasome project
Very interesting information Paula. This information shows the real Steemit reward system. One guy heijin is able to get around 25 of total payout and 24% posts are getting nothing. Why will anyone invest in a platform where this much discrimination is present? This platform cannot grow much without amending reward distribution system.
there has been a lot of discussion and actions with heijin taking so much of the rewards pool. he gets a lot of flags to try and reduce it.
He has invested more than $1.5M in STEEM and played the system by voting for his other account. It is OK by STEEM white paper.
I am kind of surprised to see that the number of comments has been on a decline, but I guess with fewer active people, and the price and the value of a vote it is somewhat easy to see. You would think though with few post there would be more comments. Hopefully the commenting levels will pick up a little bit over the next month.
Very insightful post, with some serious indicators.Every month report would be more appropriate i think
Thank you for you feedback, looks like people see the value in a monthly post 😁
Posted using Partiko Android
That decrease in overall posts has certainly been felt. It also feels perhaps from a psychological point of where the current value of Steem is at that many are putting in less effort/time in the content they create. Since they are having to weight in the opportunity costs of what time spent here can earn verses elsewhere.
Granted there are still quite a few who understand now is the perfect time to put in the effort and keep being amazing. I just hope most of those who are still amazing can stay motivated to keep going during these times. I can see so many returning when “times are good again” and come to the realization they should have done more.
When people return cos the price is right for them, i dont know if i would give them the same support, what do u think?
Posted using Partiko Android
My comment went a bit long. I thought it best to just make it a blog and not leave a wall of text in your comment section :)
https://steemit.com/rant/@enjar/thoughts-on-return-of-the-masses-when-ever-that-is
I hope you don't mind. If you would like me to remove the link just ask. Have a beautiful Sunday and an even better week!
I love a good rant! glad to leave it here
Hmm, apart from @haejin for his bad rep, @adsactly and @acydio, I don't recognize any of the top gross payout earners for August. I also didn't have a clue dlive, photography and life categories are so far ahead of the others, in their share of the reward pool.
Thanks for this report Paula!
Hi Paula, are your "posting hours" in UTC or your server's local timezone?
Thanks.
Now you got me. I would say servers local time but right now im not 100% will check
Posted using Partiko Android
Probably utc/gmt then. I was curious, because 15:00 if it means say, 3pm est, a peak posting time on your charts, would make sense, since a huge portion of the world is under the sun and awake at that time. Just an anecdotal, unscientific thought.
Great work as always <3. Happy to assist with you staying above those medians by commenting/upvoting and even resteeming! :)
@sammosk my buddy. Thanks for stopping by and for your continued support 😁
Posted using Partiko Android