Weekly Analysis: Detailed Technical And Fundamental Analysis Of Steem, Steem Dollar, Bitcoin And USD
Attention: This post has been written by @princewahaj
The coming week is full of crucial things fundamentally and if we go to charts and ask to testify, then charts are also confirming and indicating some great moves in coming week. I am now running "Weekly Analysis" to keep you and myself up-to-date and warn about possible dangers, and to give you some possible glad tidings :) Of-course we can never know with 100% accuracy. Keep this fact in mind and lets discuss further.
We will analyze the following:
- USD Index
- Bitcoin
- Steem
- Steem Dollar
You might question me, why USD? Well, if you're not new to these analysis things, you will obviously know that USD serve as a benchmark currency for all instruments. And most of them are pegged with direction of USD. Some have positive correlation and some have negative correlation with USD. Positive correlation means, if USD moves up, another currency will move up too, and negative correlation means, if USD moves up, then another currency will move down.
Bitcoin, Steem and Steem Dollar, all of them are correlated with USD. They do not move in the same way, they move in different way but they take direction from USD. And of-course this is just a technical bias. Other thing matters too like supply and demand of other instruments which further push a currency up or down or restrict them sideways.
Relation Of Bitcoin, Steem and Steem Dollar With USD:
Lot of steem members are confused about it, and one of the recent post of @dantheman explained the part of their confusion and another part was well-explained in comments by other members. I wouldn't go in-depth because this topic is about analysis. See what happens if USD moves up. See example below:
If USD moves up, bitcoin will go down against USD, and if bitcoin goes down and USD rises up, Steem and Steem dollar will rise.
Do not forget that price movements do not SOLELY depends on USD movements. There are other fundamental reasons behind their fall like supply and demand. No need to go in such detail.
So, now as you understand the relation. I feel that you're ready to read these technical parts and I'm sure you will now understand my points well enough.
Technical And Fundamental Analysis Of USD Index:
It is must to go through the outlook of USD first, and analyze in-depth of what to expect. Lets look at the chart below: (USD Daily Chart)
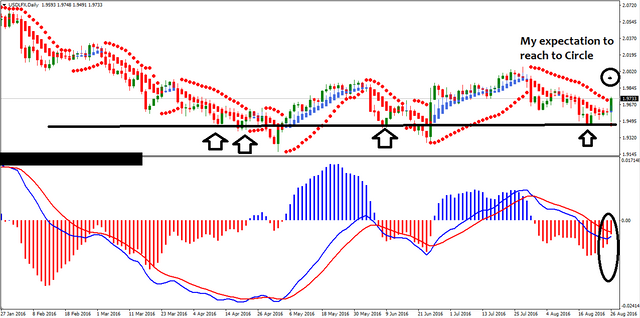
Chart from LiteForex (For educational purpose only)
Above chart is clearly indicating that USD gonna rise further. The USD chart was last updated on Friday and the last bull candle was the result of MS Yellen Speak which is a fundamental reason. But if you look again on the chart, you will see that I drew a black horizontal line to show how important this support level is. We already had around 4 big reactions from horizontal line.
In short, USD bounced from the support first before moving up which can be a sign of long-term up moves. When we look on economic calender, we see these upcoming events:
- ADP Non-Farm Employment Change - This Wedneday (This is considered a huge report and put high impact on USD)
- Non-Farm Employment Change - This Friday (Very Huge - Can turn the tables within seconds)
These fundamental aspects truly confirms my bias that USD can rise within short period of time because of the fact that Yellen's speech gave lot of power to USD support level.
Conclusion: USD have all the supports to rise further.
Technical And Fundamental Analysis Of Bitcoin:
Looking at the situation on chart, we can clearly see that bitcoin is going through difficulties and now standing at a crucial level. Let us look at the chart below:
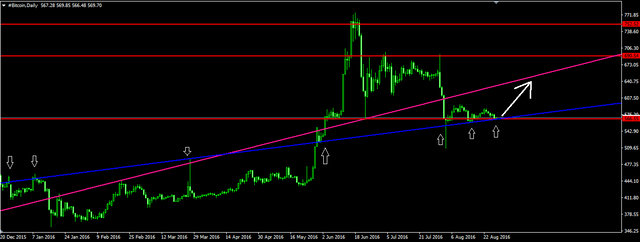
Charts from InstaForex (For educational purpose only)
Bitcoin is standing at great support level + good (blue) trendline. This situation suggests that bitcoin will rise but I'm not really expecting the rise of bitcoin yet. To calculate the validity of my expectation, I had to analyze the chart further in-depth to find out whether my expectation contains any potential or not, and finally I was able to analyze as such that more big evidences came out. Look at the chart below:
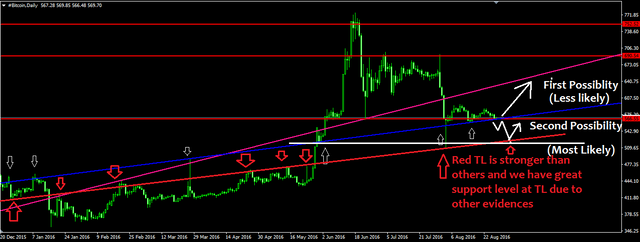
The chart might look complicated to you but hey, its very simple. Finally, that chart gave me a peace of mind that my expectation is full of evidences. Let me explain those evidences:
Red trendline contains more touches and all of those touches caused great reversal just like you can see yourself too. Furthermore, you can look at the low of 3rd August. Surprisingly, both evidences (the low and the trendline) are meething with each other confirming a big upcoming blast.
Another evidence is the psychological level of $500 . BTC can fall till $510 very easily because we have all the necessary support from USD and this coming Friday, NFP will cause a big blast for sure.
Conclusion: Bitcoin is expected to drop further.
Technical And Fundamental Analysis Of Steem And Steem Dollar:
Here comes the important part. Some of steemit members are curious and clueless of what to expect technically but as we already discussed the relation of USD and Bitcoin with Steem and Steem, it will be easy for us to reach to conclusion.
Steem:
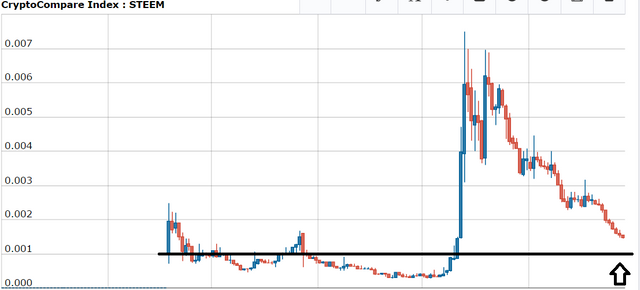
Charts from CryptoCompare (For educational purpose only)
Looking at the Steem chart, it looks like Steem is very near to important support level and it is unlikely to touch the black line. I expect a quick recovery of steem in coming days. Black line holds the level of 0.001 which serves as a great psychological level. You can see yourself how people reacted on that level.
Conclusion: Steem do not yet show any kind of sign of reversal but the level of support indicates that we will have all the signs in a day or two. 90% chances are that, steem will rise because USD is also rising, and remember that Steem is pegged with USD.
Steem Dollar:
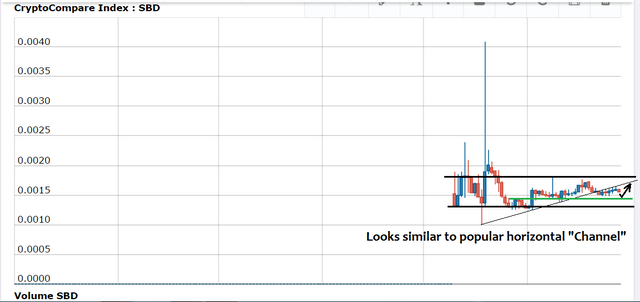
Chart from CryptoCompare (For educational purpose only)
Just like we discussed earlier, Steem and Steem dollar are pegged with USD. You can see how Steem dollar did a quick recovery in last 3 days. Due to lack of history, current chart looks like a horizonal "Channel" which is very famous for indicating moves in advance.
Green horizontal line is a recent support level which might come into play. SBD might drop slightly before moving up because there are other important reasons too. Some people are crazily withdrawing their steem dollar. When I looked at bittrex, I saw that there were large number of bids (around 108,000 SBD to sell) and only 10,000 SBD were in demand. We all should support steemit by purchasing more but we all should do it at our OWN risk.
Conclusion: Steem dollar chart showing enough evidences that SBD will rise further. But before it rise, you might experience a slight drop because SBD may need to take support from its strong support level.
Steem and steemit's future looks very bright and things gonna change in positive way but as always, this is just like a speculation. Steem dollar can have value of even $5 to $15 in future or it might value dust just like @dantheman explained here.
So, this was my first weekly analysis. If you liked my analysis, please consider to follow me at @princewahaj . I'll be doing these analysis on weekly basis and I hope we all benefit from it. Here is my introduction post in case if you like to know more about me.
Important Note: I do not advise anyone to take action based on my analysis. These analysis were meant for educational purpose only. If you want to take any action, please do it at your own risk. I will not be responsible for your buy/sell actions.
Attention: This post has been written by @princewahaj
@knozaki2015 features authors and artist to promote them and a diversity of content. https://steemit.chat/channel/academy (if you want to get in touch)
The author will receive 100% of the STEEM Dollars from this post
Don't just follow me, follow the author as well, if you like their post @princewahaj
The TA on SBD is baseless. SBD is dependent on a relationship between BTC and STEEM price, and adjusted for spread between exchanges. Its implied discount is derived from author selling pressure, and interest rate. TA probably has about < 1% overall impact on its price.
Hi @furion , Its true. As I said before. due to lack of history, current look of sbd chart looks like a horizontal channel and green trendline doesn't really mean much. It just an indication that price might drop till green line before moving upwards.
Thanks for your comment. I appreciate it. Just my thoughts that as long as there is even less than 1% impact, we can't really call it baseless because we never know when this 1% start to put high impact :) Once again, thanks for taking your time to read it. I agree with all other things you said.
The term steem is pegged to the usd is simply wrong! SBD is pegged but not steem
Hi @knircky , thanks for raising this point. The term "Steem is pegged to the USD" is not wrong because it is pegged "indirectly". Please refer to the "Relation" heading of my article again where I explained relation.
When USD will move in any direction, it will affect BTC at first, and since steem is priced against BTC like STEEM/BTC then BTC will then affect Steem and Steem dollar. If the effect of USD on Steem is good, Steem Dollar will rise in huge way. If the effect of USD on Steem is bad, Steem Dollar will fail to rise.
So, directly or indirectly, everything is pegged with USD.
You are right, everything is pegged with USD now)) You have considered the price of the dollar under an interesting angle. I like it and i follow you. I'll wait for the next analysis.
In my opinion
SBD is pegged but Steem is not pegged and steem price drop from 4$ to 1$
But that is a good opportunity to power up our steem power because we can buy steem on cheaper price.
Indirectly pegged. But I started to think that right word to use is "correlation" even if little and "pegged" might not be the right word in steem case. I will study this case and in my next analysis, I'll explain this part. Anyways, thanks guys.
i am sure prince will answer that soon !
Very good analysis. Hope you don't mind that I've used your article as a demo content for the new steem knowledge base and forum we launched today at http://www.steemsupport.com
Thanks. I won't mind. Instead, I appreciate your pick. :)
Great analysis. Very reassuring for bagholders😆
GJ!!!
Good analysis and a good read. I look forward to your future posts and analysis.
Steem on,
Mike
this is good evaluation, thanks
upvoted an older chart of the Author as well.
exact
Thank you guys! I really enjoyed that post!