Zane's Crypto Chart Spotlight: STEEM! 21 June 2017
Zane’s Crypto Chart Spotlight: STEEM!
Welcome back Traders/Investors/Chart Enthusiasts/Everyone!
This 2nd edition covers our beloved STEEM.
My goals: I want to provide:
Help with becoming more comfortable with reading a chart and knowing what to look for so you aren’t buying at poor places and limiting your gains and at the same time increasing your risk and stress levels.
Better understanding of the chart scenario. What do those patterns mean again? What is the sentiment? What are other people in the trade thinking? I’m here to help clarify that.
Put my knowledge to the test in working hard to filter thru the crypto coins to find the ones that I believe have a higher probability at continuing its trend earlier than the others do. Who wants to be in positions that don’t move?
Safer Entry Zones so you can worry less about a stock reversing on you by a large %.
Likely Exit Zones so you aren’t holding too long or exiting too early before the move happens.
I began a short while ago providing technical analysis on one crypto coin of my choice each day. I enjoyed sharing my analysis to anyone interested in trading, investing, or just trying to learn about charting in general to gain an edge.
My Takeaway:
I didn’t feel that I was providing relevant enough information that made people want to check back in with my posts. I felt like I could provide more value and build up my credibility while still upholding my original idea of providing fresh, high quality technical analysis AND giving potentially actionable scenarios. Following up w/ them is something I wanted to do too as the picks played out.Obligatory Disclaimer:
I’m not guaranteeing any of these coins will do anything I say. I'm hoping for the best but expecting anything.I am attempting to point out what I believe are coins that are behaving better and more reliably than the rest. Buying blindly has worked in this market so far, but it is unlikely to last for much longer. Knowing this, it is important to know what a better scenario looks like when compared to an average or below average entry location.
Now that you know my goal, let’s move on to my first pick!
Coin: STEEM
What I’m Seeing:
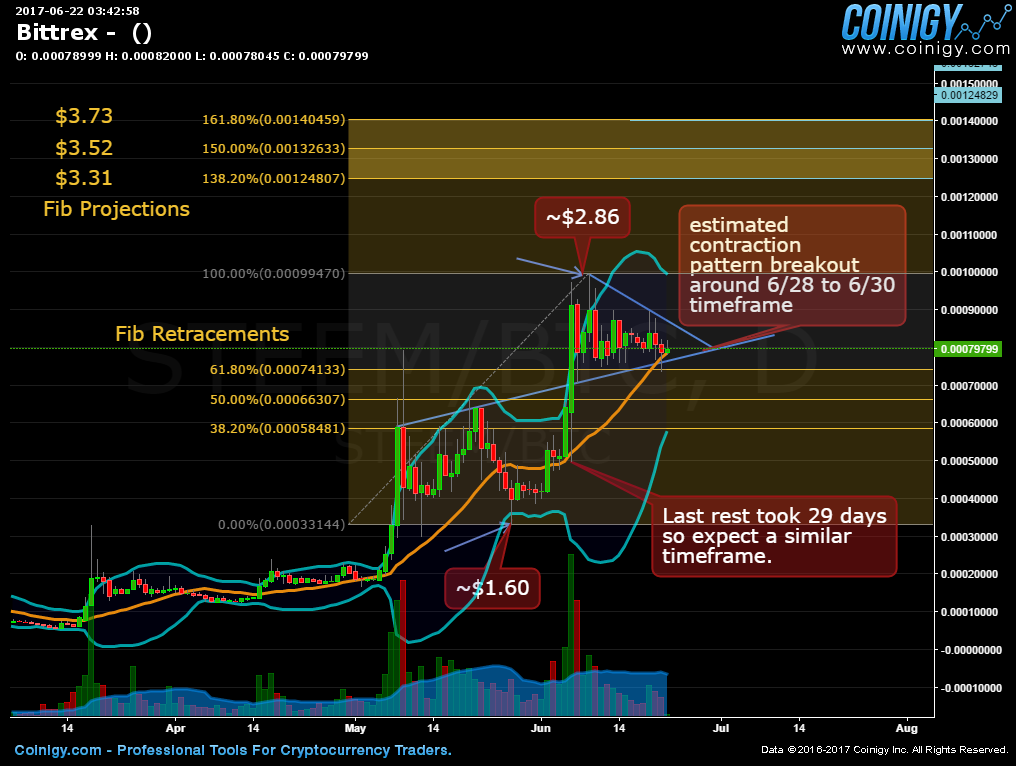
Uptrending since Mid April 2017. The strong breakouts that have held previous resistance levels are serving as new support which is very positive for the bullish trend.
The 15 day resting and contracting pattern shape. This resting pattern shows a lot of demand b/c the rest after the breakout occurred without giving back much in terms of price. Instead, it traded sideways to allow for the rest. It’s still a great chart pattern to have but the only difference is that the expected “profit takers” haven’t really stepped in yet so they will be anticipating the next breakout relatively soon which is why I like this chart so much.
If the pattern holds its current lows around the $1.95 area and breaks out to new highs then expect a run into the Fib levels shown in the chart.
The Turquoise Bollinger Bands: The recent contraction in price range is shown by them angled towards each other and coming closer together. Notice they aren’t as close as one would hope to see before a pop so we could be waiting a week or two before this occurs. The tighter the Bollinger Bands are the higher % chance of a move happening sooner.
The Blue Trend lines: You can think of them as short term guardrails where participants expect the price to stay within until deciding its next move, either a breakout or breakdown.
Entries:
A break above the upper blue trendline would signal the first attempt to continue the upward trend. No promises here. I am calling out scenarios and locations to expect it to happen.Others that love the coin won’t mind buying it anytime they can so do what you prefer. Either way, to me its at a great time to enter because the trend is strong and it has rested well so you aren’t chasing it right now.
To throw a little water on this super hot chart I just want to reiterate that nobody knows what is going to happen. We can only look for areas to act that give us higher probabilities for success.
Next major targets:
Target area 1: ~$2.86 (recent highs)Target zone from Fibs:
138.2% = $3.31
150.0% = $3.52
161.8% = $3.73
I hope you enjoyed this breakdown. Let me know what you think about my review. Too long/too short? Which coins do you think are about to move? Comment below!
I look forward to your comments! If you benefited from this please follow and up vote!
Thanks,
Zane
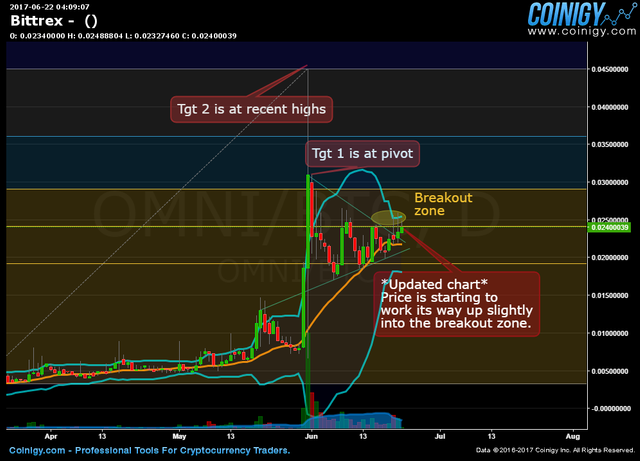
A quick chart update from yesterday's OMNI spotlight blog
another great daily crypto post. Thx Inzanity!
Glad you liked it. Thanks!
Is this is the correct area? I figured if anything could go in the Steemit section it would be STEEM analysis.
If I'm mistaken, please politely explain and I'll correct it.
Thanks!
Thanks for sharing an insight, Upvoted!
Thank You very much!
Congratulations @inzan1ty! You have completed some achievement on Steemit and have been rewarded with new badge(s) :
Click on any badge to view your own Board of Honnor on SteemitBoard.
For more information about SteemitBoard, click here
If you no longer want to receive notifications, reply to this comment with the word
STOPBy upvoting this notification, you can help all Steemit users. Learn how here!
Just powered up!