Zane's Crypto Chart Spotlight - OMNI consolidation!
Hi Everyone!
I’m very excited to present to you my new vision of my blog!
(quick intro first, please don't tldr me!)
I’ve seen really awesome stuff being shared and I wanted to contribute in my own realm in my own way...Great chart analysis combined w/ great coin picks!
My goal is to provide:
Help with becoming more comfortable with reading a chart and knowing what to look for so you aren’t buying at poor places and limiting your gains and at the same time increasing your risk and stress levels.
Better understanding of the chart scenario. What do those patterns mean again? What is the sentiment? What are other people in the trade thinking? I’m here to help clarify that.
Put my knowledge to the test in working hard to filter thru the crypto coins to find the ones that I believe have a higher probability at continuing its trend earlier than the others do. Who wants to be in positions that don’t move?
Safer Entry Zones so you can worry less about a stock reversing on you by a large %.
Likely Exit Zones so you aren’t holding too long or exiting too early before the move happens.
I began a short while ago blogging to provide technical analysis insights on one crypto coin of my choice each day.
I enjoyed sharing my analysis to anyone interested in trading, investing, or just trying to learn about charting in general to gain an edge.
My takeaway:
I didn’t feel that I was providing relevant enough information that made people want to check back in with my posts. I felt like I could provide more value while still upholding my original idea of providing fresh, high quality technical analysis AND giving potentially actionable scenarios. Following up w/ them is something I wanted to do too as the picks played out.Obligatory Disclaimer:
I’m not guaranteeing any of these coins will do anything I say. This is advice w/ good intentions.I am attempting to point out what I believe are coins that are behaving better and more reliably than the rest. Buying blindly has worked in this market so far, but it is unlikely to last for much longer. Knowing this, it is important to know what a better scenario looks like when compared to an average or below average scenario.
Now that you know my goal, let’s move on to my first pick!
Coin: OMNI

What I like/Notes:
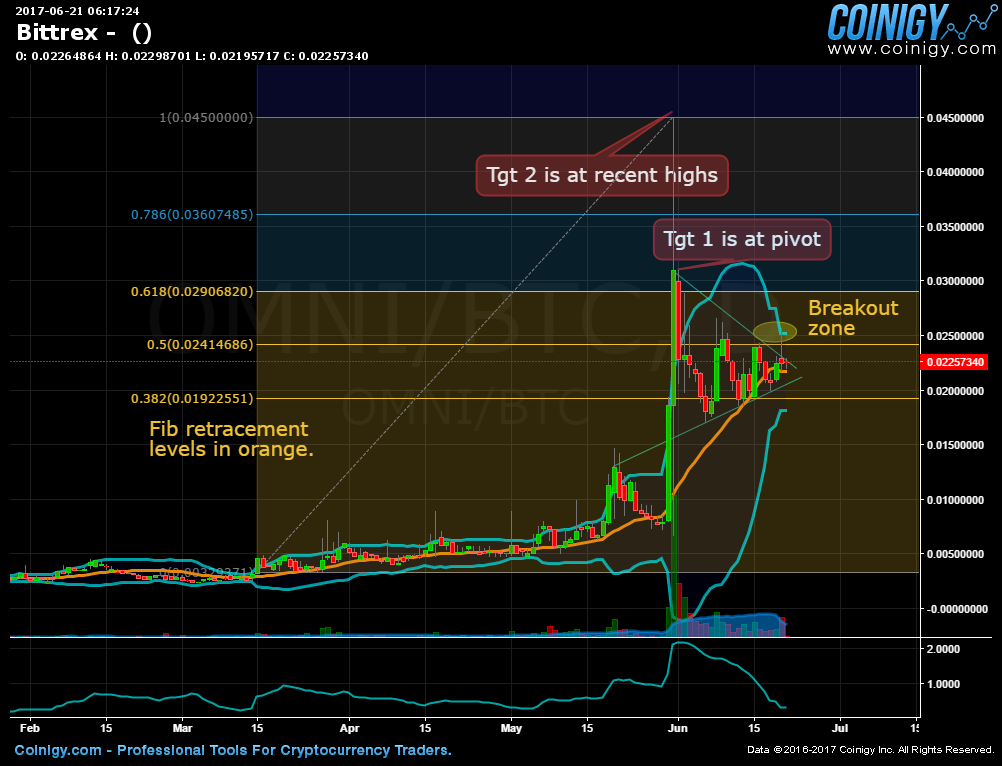
~1) Uptrending since March 2017. Most importantly to me, it has had a strong breakout while in an uptrend.
~2) The contracting pattern over the last 21 days is a great retracement scenario to a potential move higher. The turquoise Bollinger Bands show the recent contraction in price range. These typically lead to breakouts when the patterns converge as it is currently doing now.
Insight: Breakouts from consolidations can happen in either direction and even can test one side before reversing to the other side, so, please, understand this and expect it. It doesn’t mean the trend is broken until sustained price movement holds on the down side for many days afterwards.
Compare this tightening of the Bollinger Bands just before the last breakout and you see what has me interested in this coin. It was a move from .00620000 BTC up to .01472000 BTC, a 137% move!
Higher lows shows interested buying pressure still there. The tighter the Bollinger Bands get the more likely a violent breakout/breakdown will occur.
~3) I drew a green short term trendline and it has been working as support over the last 21 day resting pattern.
The up days are relatively larger compared to the down days showing there is anticipation for this trend to continue, but there haven’t been enough interest as of yet to breakout again.
~4) A break above the triangle consolidation I have drawn would trigger a trend continuation breakout and an active entry.
Buying at the 20SMA is another good location to enter this bull trend if you are a more long term trader and can handle more risk.
For active traders waiting to see the triangle breakout is a better entry so you aren’t anticipating the continuation before it happens.
Next major targets:
Target area 1: 0.03099898 BTC
Target area 2: 0.04500000 BTC
A break to the downside out of the consolidation triangle that held below for several days without coming right back up would signal that this trend is no longer as strong as I had hoped and I would consider the trend sentiment to be waning from “strong bullish” to “average bullish” and needs more time to prove its strength.
I hope you enjoyed this breakdown. Let me know what you think, which coins you think are about to move, or anything in general.
I look forward to your comments! If you benefitted from this please follow and upvote!
Thanks,
Zane
Its looking like OMNI is trying to breakout. Just 8 hours later. Let's see how it goes.
https://www.coinigy.com/s/i/594a80a74ad69/
Congratulations @inzan1ty! You have completed some achievement on Steemit and have been rewarded with new badge(s) :
Click on any badge to view your own Board of Honnor on SteemitBoard.
For more information about SteemitBoard, click here
If you no longer want to receive notifications, reply to this comment with the word
STOPBy upvoting this notification, you can help all Steemit users. Learn how here!
I like your post. Upvoted and Following!
I also wrote an analysis about Omni today. Unfortunately it is in german. But you can see my point in the pictures aswell.
https://steemit.com/deutsch/@derboersennerd/omni-nach-ausbruch-aus-gleichschenkeligen-dreieck-upmoove-favorisiert
All the Best! :-)
Nice @inzan1ty you made me 33% on this. Bought and sold at your targets!