Steem.Supply Update: Historical SBD / STEEM Evolution Chart
One of the most common requests for steem.supply has been a chart for the historical SBD to STEEM conversion (by "historical" I mean a reasonable amount of time, like 7 days). So, after digging up a few API providers, brushing up on my Google chart skills, adding a few functions to the steem.supply codebase and drinking a delicious cocoa and cinnamon concoction I made myself (the secret being adding a dash of cocoa milk, if you really want to know), here we are, with a new feature.
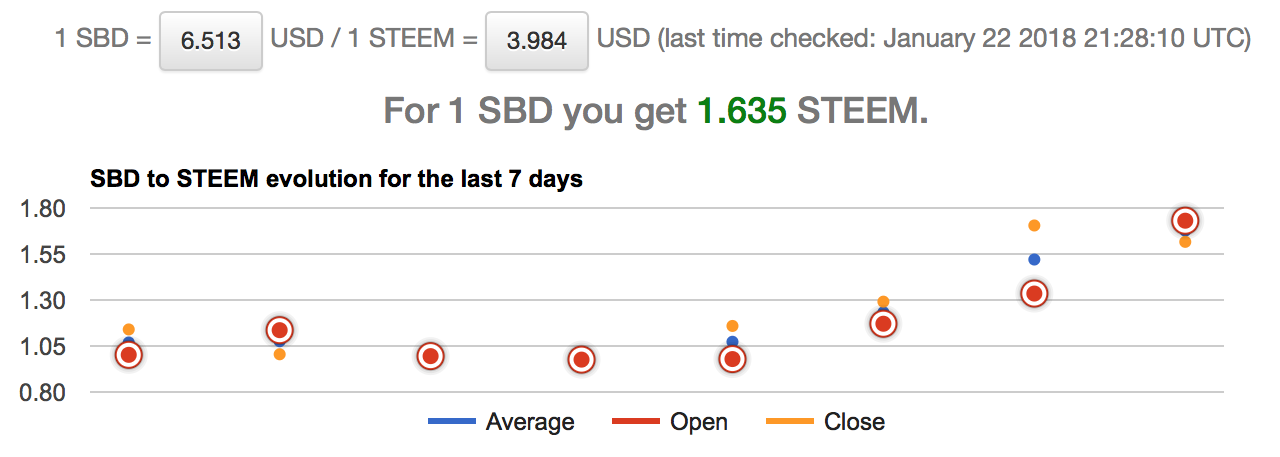
The chart is displaying the last 7 days ratios for SBD and STEEM, or how much STEEM could you get for 1 SBD. The days are calculated in UTC, starting at 0:00. Hovering over points will display the exact price and date. If you want to highlight a specific series, just click on the line in the legend.
There are 3 series: average, open and close.
- average - the average price for that day
- open - the price at the beginning of that day
- close - the price at the end of that day
As you will see, some very interesting trends and correlations can be made with only these 3 numbers.
For instance, today we opened high:

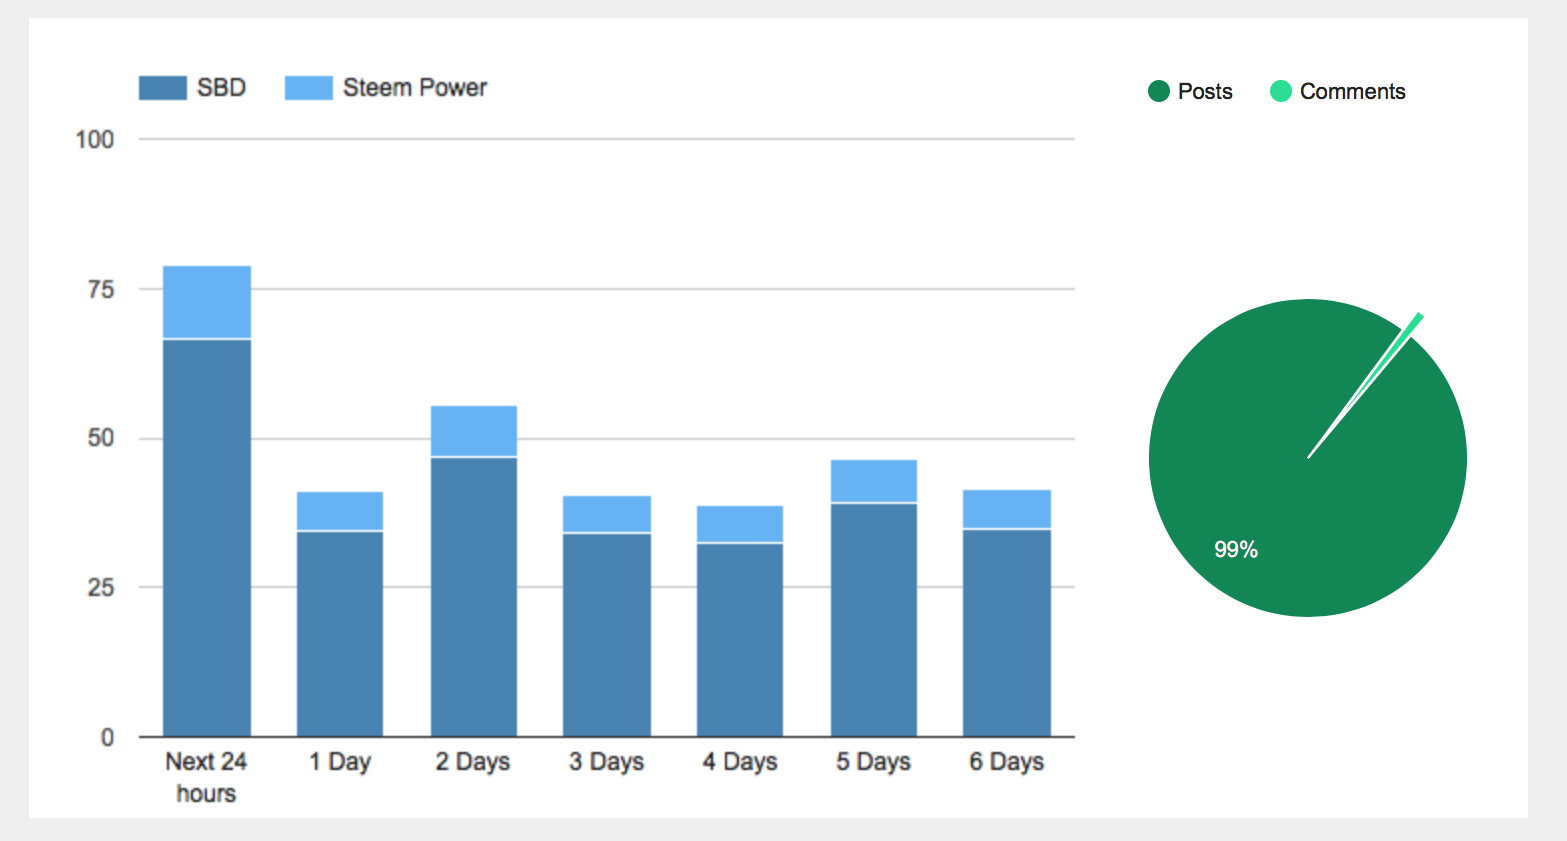
but we're going to close lower:

As always, looking forward to your feedback, criticism and suggestions.
I'm a serial entrepreneur, blogger and ultrarunner. You can find me mainly on my blog at Dragos Roua where I write about productivity, business, relationships and running. Here on Steemit you may stay updated by following me @dragosroua.

Wanna know when you're getting paid?

|
I know the feeling. That's why I created steem.supply, an easy to use and accurate tool for calculating your Steemit rewards |
ty for this chart it is good to know
hey man, did i find a bug? -- http://steem.supply/@dayleeo -- she's switched to 100% steem power out for her last two posts and that seems to break the display. cheers, hope your good.
Thanks for the heads up, classical case of uninitialized var propagating down. Solved now.
She will see 0 in USD, because the table displays only liquid rewards, but the SP will still show in the chart, or when she will choose to display in STU.
Cheers!
welcome man, i know you like to be on these things ;)
I was busy, so you added the connecting lines before I got to comment on it :D
Since many people are interested in the "1" ratio as baseline, I'd add a hard line for that, if you are able to.
Finally, another request, if possible, could you return to someplace on the page the current feed price of Steem? The use of that is for advanced users like me, who can then gauge whether STU reward count of posts will go up or down over the next few days.
Thanks again for all the hard work!
Edit: And should probably avoid having all 3 spots at the same spot at the start of the day, just don't show open/close util relevant :3
Thanks, will definitely add a hardline for "1" and will think about the other 2 :)
That is a whole lotta improvement.
Thanks so much for the implemention of this graph. At once I can see where the second derivative is heading and it will trigger in my head buy or sell decision.
One way i ok with sbd going back to the usd peg and another way sad bc my upvote techanly was worth way more. :(
your upvote is relative to the worth of steem and not sbd I think.
it is in theory but technically you can get more steem using sbd
https://steemit.com/steemit/@dragosroua/now-that-1-sbd-trades-below-1-steem-is-it-better-to-set-my-rewards-to-100-power-up
with since sbd are "worth more" than steem you can get even more steem
It shows a rising wavelike pattern. I think now is still a good window of opportunity to buy Steem and power up.
Powering up locks you in for 13 weeks, this one isn't as violent as the last giant bull run, but both ran out of steam pretty fast. We're already on the downtrend, and steem doesn't seem to be nearly as attractive to trade as SBD does on the markets where all the real speculation is happening. Just my opinion.
I've been starting to get worried about when the best time to convert SBD to Steem is and this will definitely help.
Oh yeah! That's an awesome new feature. I don't suppose it would be possible to extend the time frame to say 30 days? That would be beyond awesome. But still bookmarked.
It's not that difficult, if there is enough request, I might do that as well.
could be useful for predictions. But 7 days is enough for me. The older graphs can be hold in ones memory. LOL.
Next you need to add how long until it reaches To The Moon!.
Calculating "To The Moon"
I might just do that :)