10July2018 Steem Price Analysis....10Temmuz2018 Steem Fiyat Analizi
We are trying to analyze Steem that we can earn from Steemit and it will be the most important cryptocurrency in my opinion. We will analyze according to Steem/BTC value. Now Steem is 2120 sathoshi.
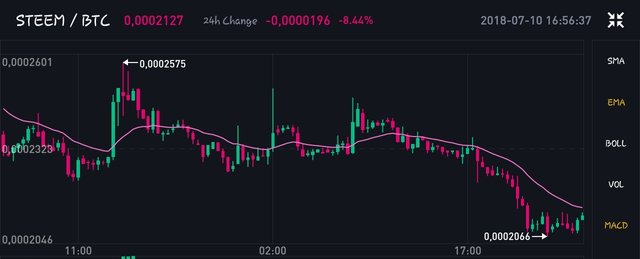
Looking at the EMA chart, the chart can begin to increase the price by crossing the candle chart and EMA with a small movement that tends to turn upwards.
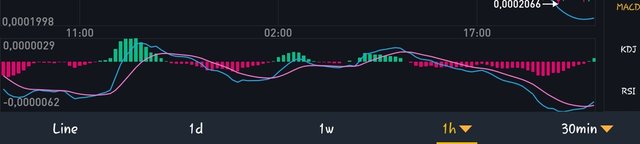
When we look at the MACD chart, the chart begins to go on upward. It means the price will increase. It could be the movement that we expect.
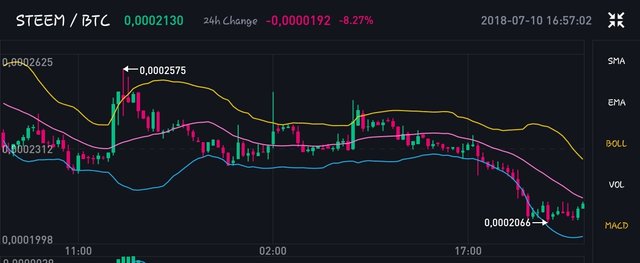
In the bollinger chart, the graphic hit the bottom band and starts to go upward. If we combine the other two graphics its price could increase.
We use data from Binance and GoBaBa. If you dont have an account yet pls register.
Steemit üzerinden kazanabildiğimiz ve bana göre gelecekte kripto paralar arasında soz sahibi paralardan biri olan steem için analizi yapmaya çalışalım. Analizimiz Steem/BTC değerine göre yapılacaktır. Şuan ki değeri 2120 sathoshi.
EMA grafiğine baktığımızda grafik yukari doğru dönme eğiliminde küçük bir hareket ile mum grafik ve EMA kesişerek fiyat artışı başlayabilir.
MACD grafiğine baktığımızda trend yukarı yöne geçmeye başlamış artış baslayacak gibi. Yani bir üst grafikte olmasını beklediğimiz artış geliyor gibi.
Bollinger grafiğinde ise steem alt banda çarpmış ve yukari açılmaya başlamış. Üstteki iki grafikle birleştirdiğimizde yukarı doğru bir artış bekliyorum.
Analizlerimizi Binance
Ve GoBaBa verilerine göre yapmaktayız. Üye olmakda geç kalmayın.
What is the full name of EMA ?
Exponential Moving Average https://steemit.com/tr/@cryptosman/basite-indirgenmis-teknik-analiz-dersleri-3-ma-hareketli-ortalamalar-baseline-reduced-technical-analysis-lessons-3-ma-moving
Thank you for your sharing !
As a follower of @followforupvotes this post has been randomly selected and upvoted! Enjoy your upvote and have a great day!