RE: Its time to dispel a few myths... again...
this is sophistry. Undoubtedly sophistry that will be elevated to the top of trending, but sophistry nontheless.
Obviously, if you start at 0 views when the site first opened, the linear projection is going to always be positive. Its literally impossible for it to project downward. There would have to be negative people looking at the site... not like negative they have a bad attitude, but negative like they're a family of -4 who loaded up the site one day.
If i started a graph on the day they manufactured the first commodore 64, then projected a line for C64 ownership from then until the present, it would look like c64 ownership was trending upwards... because no matter how many people throw out their commodore 64s (unless its all of them), there will always be more who own them than there were on the day before they were first manufactured.
Yes, we have more people looking at the site now than we did before the site existed. That basically goes without saying (except i guess it doesnt).
Project the numbers forward from any time after the site went public (early july, iiuc) and they will tell a vastly different story.
Edit to add -- its hilarious that you include the 0 to -10000 views cohort on your graphs to make it look like it would be possible for them to trend downwards.
I think you missed the point...
There was pre-4th July
Then the massive FOMO spike followed by extended decline
Then since October, comparative stability.
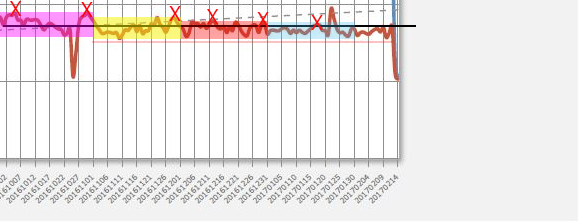
not really. Early october, we hit what was then an all time low (which i plotted forward horizontally). Notice how that used to be a low point for us then a mid point, then a high point?
I put each month in its own little box. Notice how the high keep getting lower? The red "x" es are high points that we reached between october and now that we would never reach again.
Note -- im disregarding the downspike from dataloss in october and in at the end, as well as the late jan spike, which seems abberant (the rolling stone article i suspect.)
So yeah, the fall off is more gradual. but thats because it already mostly happened. Its kind of like leaves on a tree in the fall. FIrst there's a lot of leaves on the tree, then a lot of leaves fall off. Then theres a few leaves on the tree and fewer fall off.
Theres a certain baseline level that well never lose. I imagine some of it is web crawlers if theyre not excluded
The red X's you draw are midweek highs and are often added too when we have semi-viral content(rolling stone article etc.)... that is discernible when the spike has a significant corresponding spike in the blue line as well.
The median between the mid-week high and the week-end low is more suited place to draw your black line.
We have recently had golos pick up and busy.org. This does not account for users that have migrated or are accessing through those interfaces. This is steemit.com only data.
Regarding crawlers, where are they in the first third of the graph?
That is the beauty of a baseline beginning at Zero. The challenge with this baseline is that it will be slightly affected by migration of users to alternate front-ends and CLI, but it is better than blockchain only activity stats as they don't weed out the bots.
He did not claim that web crawlers were (yet) a significant portion, only that they slow a numerical decline, which is correct.
BTW, golos is not an interface, it is a completely separate blockchain.