Its time to dispel a few myths... again...
Every couple of months, a narrative develops that steemit is in trouble and is going to implode any moment. Or, all that is still happening on the site is a couple of regular authors and a whole lot of bots.
Well here are the facts.
There are two baselines on this graph... users that visit once periodically - BLUE
Returning users that repeatedly come back to the steemit.com site - RED
Bots do not feature in any of these graphs as they do not access via the front-end.
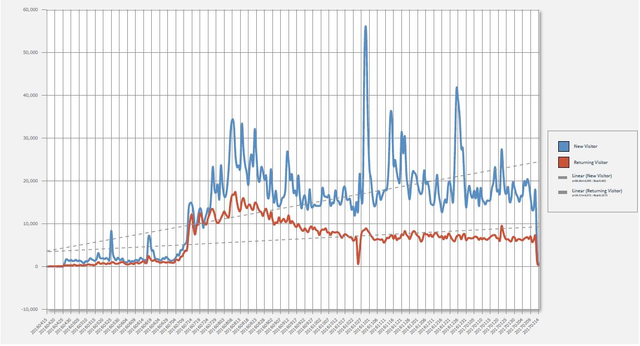
The RED line is reasonably stable since October last year, so for the last 5 months retention has stabilised. Any losses in retention have been compensated by gains in recruitment.
The major take away from this graph is the gap between the BLUE and RED lines... this speaks to conversion...
If a percentage of those users signed up every day we would instantly see growth on the platform. Making the Steemit UX awesome will assist in this regard.
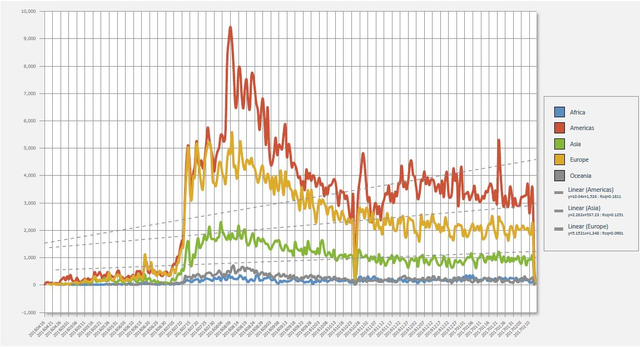
The massive spike in RED co-insides with the dollar vigilante sign-up and the rapid drop-off is partly due to those users leaving... especially since his blog has since gone zombie operated.
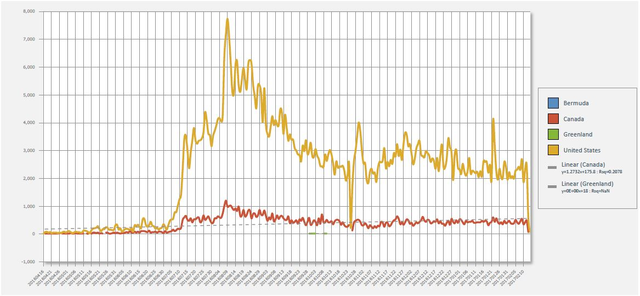
Our most volatile user group is the US... Canada by comparison is much more stable and the rest of the planet pretty much follows the less volatile trend.
The short-scale ups and downs are midweek vs week-end variations.
ps. The sharp down spike in October is a day that google lost its data and the end of graph drop off is simply because the current day is not a full days data.
this is sophistry. Undoubtedly sophistry that will be elevated to the top of trending, but sophistry nontheless.
Obviously, if you start at 0 views when the site first opened, the linear projection is going to always be positive. Its literally impossible for it to project downward. There would have to be negative people looking at the site... not like negative they have a bad attitude, but negative like they're a family of -4 who loaded up the site one day.
If i started a graph on the day they manufactured the first commodore 64, then projected a line for C64 ownership from then until the present, it would look like c64 ownership was trending upwards... because no matter how many people throw out their commodore 64s (unless its all of them), there will always be more who own them than there were on the day before they were first manufactured.
Yes, we have more people looking at the site now than we did before the site existed. That basically goes without saying (except i guess it doesnt).
Project the numbers forward from any time after the site went public (early july, iiuc) and they will tell a vastly different story.
Edit to add -- its hilarious that you include the 0 to -10000 views cohort on your graphs to make it look like it would be possible for them to trend downwards.
I think you missed the point...
There was pre-4th July
Then the massive FOMO spike followed by extended decline
Then since October, comparative stability.
not really. Early october, we hit what was then an all time low (which i plotted forward horizontally). Notice how that used to be a low point for us then a mid point, then a high point?
I put each month in its own little box. Notice how the high keep getting lower? The red "x" es are high points that we reached between october and now that we would never reach again.
Note -- im disregarding the downspike from dataloss in october and in at the end, as well as the late jan spike, which seems abberant (the rolling stone article i suspect.)
So yeah, the fall off is more gradual. but thats because it already mostly happened. Its kind of like leaves on a tree in the fall. FIrst there's a lot of leaves on the tree, then a lot of leaves fall off. Then theres a few leaves on the tree and fewer fall off.
Theres a certain baseline level that well never lose. I imagine some of it is web crawlers if theyre not excluded
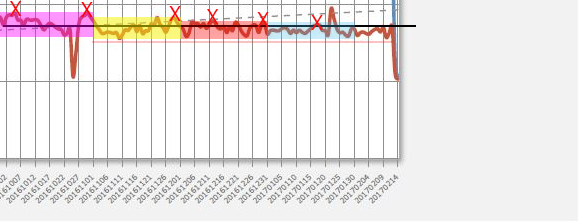
The red X's you draw are midweek highs and are often added too when we have semi-viral content(rolling stone article etc.)... that is discernible when the spike has a significant corresponding spike in the blue line as well.
The median between the mid-week high and the week-end low is more suited place to draw your black line.
We have recently had golos pick up and busy.org. This does not account for users that have migrated or are accessing through those interfaces. This is steemit.com only data.
Regarding crawlers, where are they in the first third of the graph?
That is the beauty of a baseline beginning at Zero. The challenge with this baseline is that it will be slightly affected by migration of users to alternate front-ends and CLI, but it is better than blockchain only activity stats as they don't weed out the bots.
He did not claim that web crawlers were (yet) a significant portion, only that they slow a numerical decline, which is correct.
BTW, golos is not an interface, it is a completely separate blockchain.
tack så mycket stor information
ett nöje
Thanks, very informative, steem on!
Thank you for the explanation. This makes a whole lot of sense to me. There would be no way any of us would stay if we were not committed to the platform and believed in this system.
Some would like to chase a few away by spreading FUD
Damn those volatile United Staters!
Thanks for the graphs ^_^
I'm sure a Donald is behind it, just can't decide if its Ronald Mc or Trump to blame
We are stable, which means that the number of people leaving are equivalent to the number of people joining. If it stays like this for too long, we end up with many more lapsed users than continuing, satisfied users. That would be a bad place to be in.
I also notice that when I zoom in on the graph, it seems the divergence between the blue and red lines began a week or two before dollarvigilante joined Steemit (4th August). Which would be shortly after the introduction of the new password policy (21st July).
on the second graph...
Not the divergence of the RED and BLUE in the first graph... perhaps I should have written that more clearly.
Agreed with your first comment:
very interesting!
all the steem power is leaving via bitcoin purchased from steem, and the new users all show up looking for a handout
You still stay here though. There must be something here keeping you from leaving.
I would also point out that we're still up from the lowest point with Steem, which was November 4th 2016, over 3 months ago. So since then, more money has come in than out. Doing that with an increased liquid supply as well, which makes the market cap less "artificial".
I am on week 2 of powering down 70k steem to make it liquid, because I can earn 100 times more steem trading than with curation rewards
I like your clarification posts! Thanks!
Yup... too many spreading FUD around.
It seems fine but it's clear we are not really growing at the moment.
Clearly, but once a few more prime time features are in place, we will be ready for a marketing push and able to retain the new influx.
Yep, I agree that the future is bright, and that maintaining a consistent user base despite little to no marketing or name recognition is a very good indicator.
Also this time of stabilization is not bad for consolidating a firm user base to act as a future foundation.
Nice work
Nice post, thanks.
those spreading FUD = wanting to buy cheap
(or having unrealistic expectations)