STEEM flow report #5
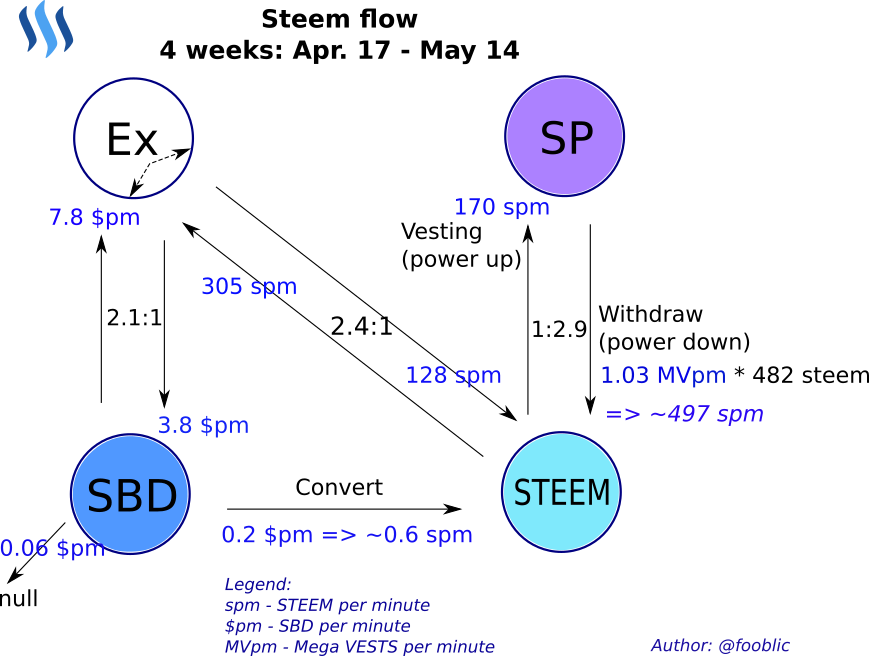
Average STEEM flow intensity for last 4 weeks:
My previous report -> STEEM flow report #4
Last week we observed next spike on STEEM price chart. The price started increasing from May, 6 and climbed the maximum on May, 9. At last time STEEM price was more than 1 USD in August 2016. I guess that Bitcoin price unprecedented summit pull itself other cryptocurrencies. At the same time issues with BTC 1Mb blocksize limitations and increasing transaction fees give a chance to other currencies to seize a part of the market. Bitcoin dominance decrease from 85% to 51% from beginning of March till now. Ethereum and Ripple have captured by 15% each.
Price charts source: coinmarketcap.com
STEEM flow intensity pumping to exchanges direction was on 7-9th of May as well. The price corrected a little down after a while.
Weekly chart shows average STEEM flow intensity increasing for last 3 weeks.
SBD flow intensity also repeat peak on 9th of May. On April 25 was short SBD peak to exchange.
On week #17 SBD flows mostly to exchanges, but on next week #18 SBD flows was almost equal.
SBD flows to Null and to Convert direction are relative small.
SP withdrawals flow is significantly less than a month ago. Withdraw/Vesting is stabilised at ratio approximately 2-3, that is small value.
Excellent work! 🤓 👍
Thank you a lot!