Posting Activity Report 12th Feb - 18th Feb
This report provides a snapshot of posting activity on the Steem Blockchain for the past 7 days.
- How many accounts are active?
- Who is posting?

Image Source: pixabay.com
Focusing on the numbers/frequency of posts (i.e. ignoring payouts) we can get a feel for who is posting as well as the level of account activity.
In the first half of the report we analyse daily posting activity in detail. For the second half we take a weekly view.
We separately analyse the frequency of posting activity by:
- Reputation of Author
- Steem Power
- Date of Joining
- Automated vs Manual Posts
This Automated/Manual categorisation is based on frequency of posting activity over the last 7 days
The data for this report is sourced from https://steemdata.com/ by @furion
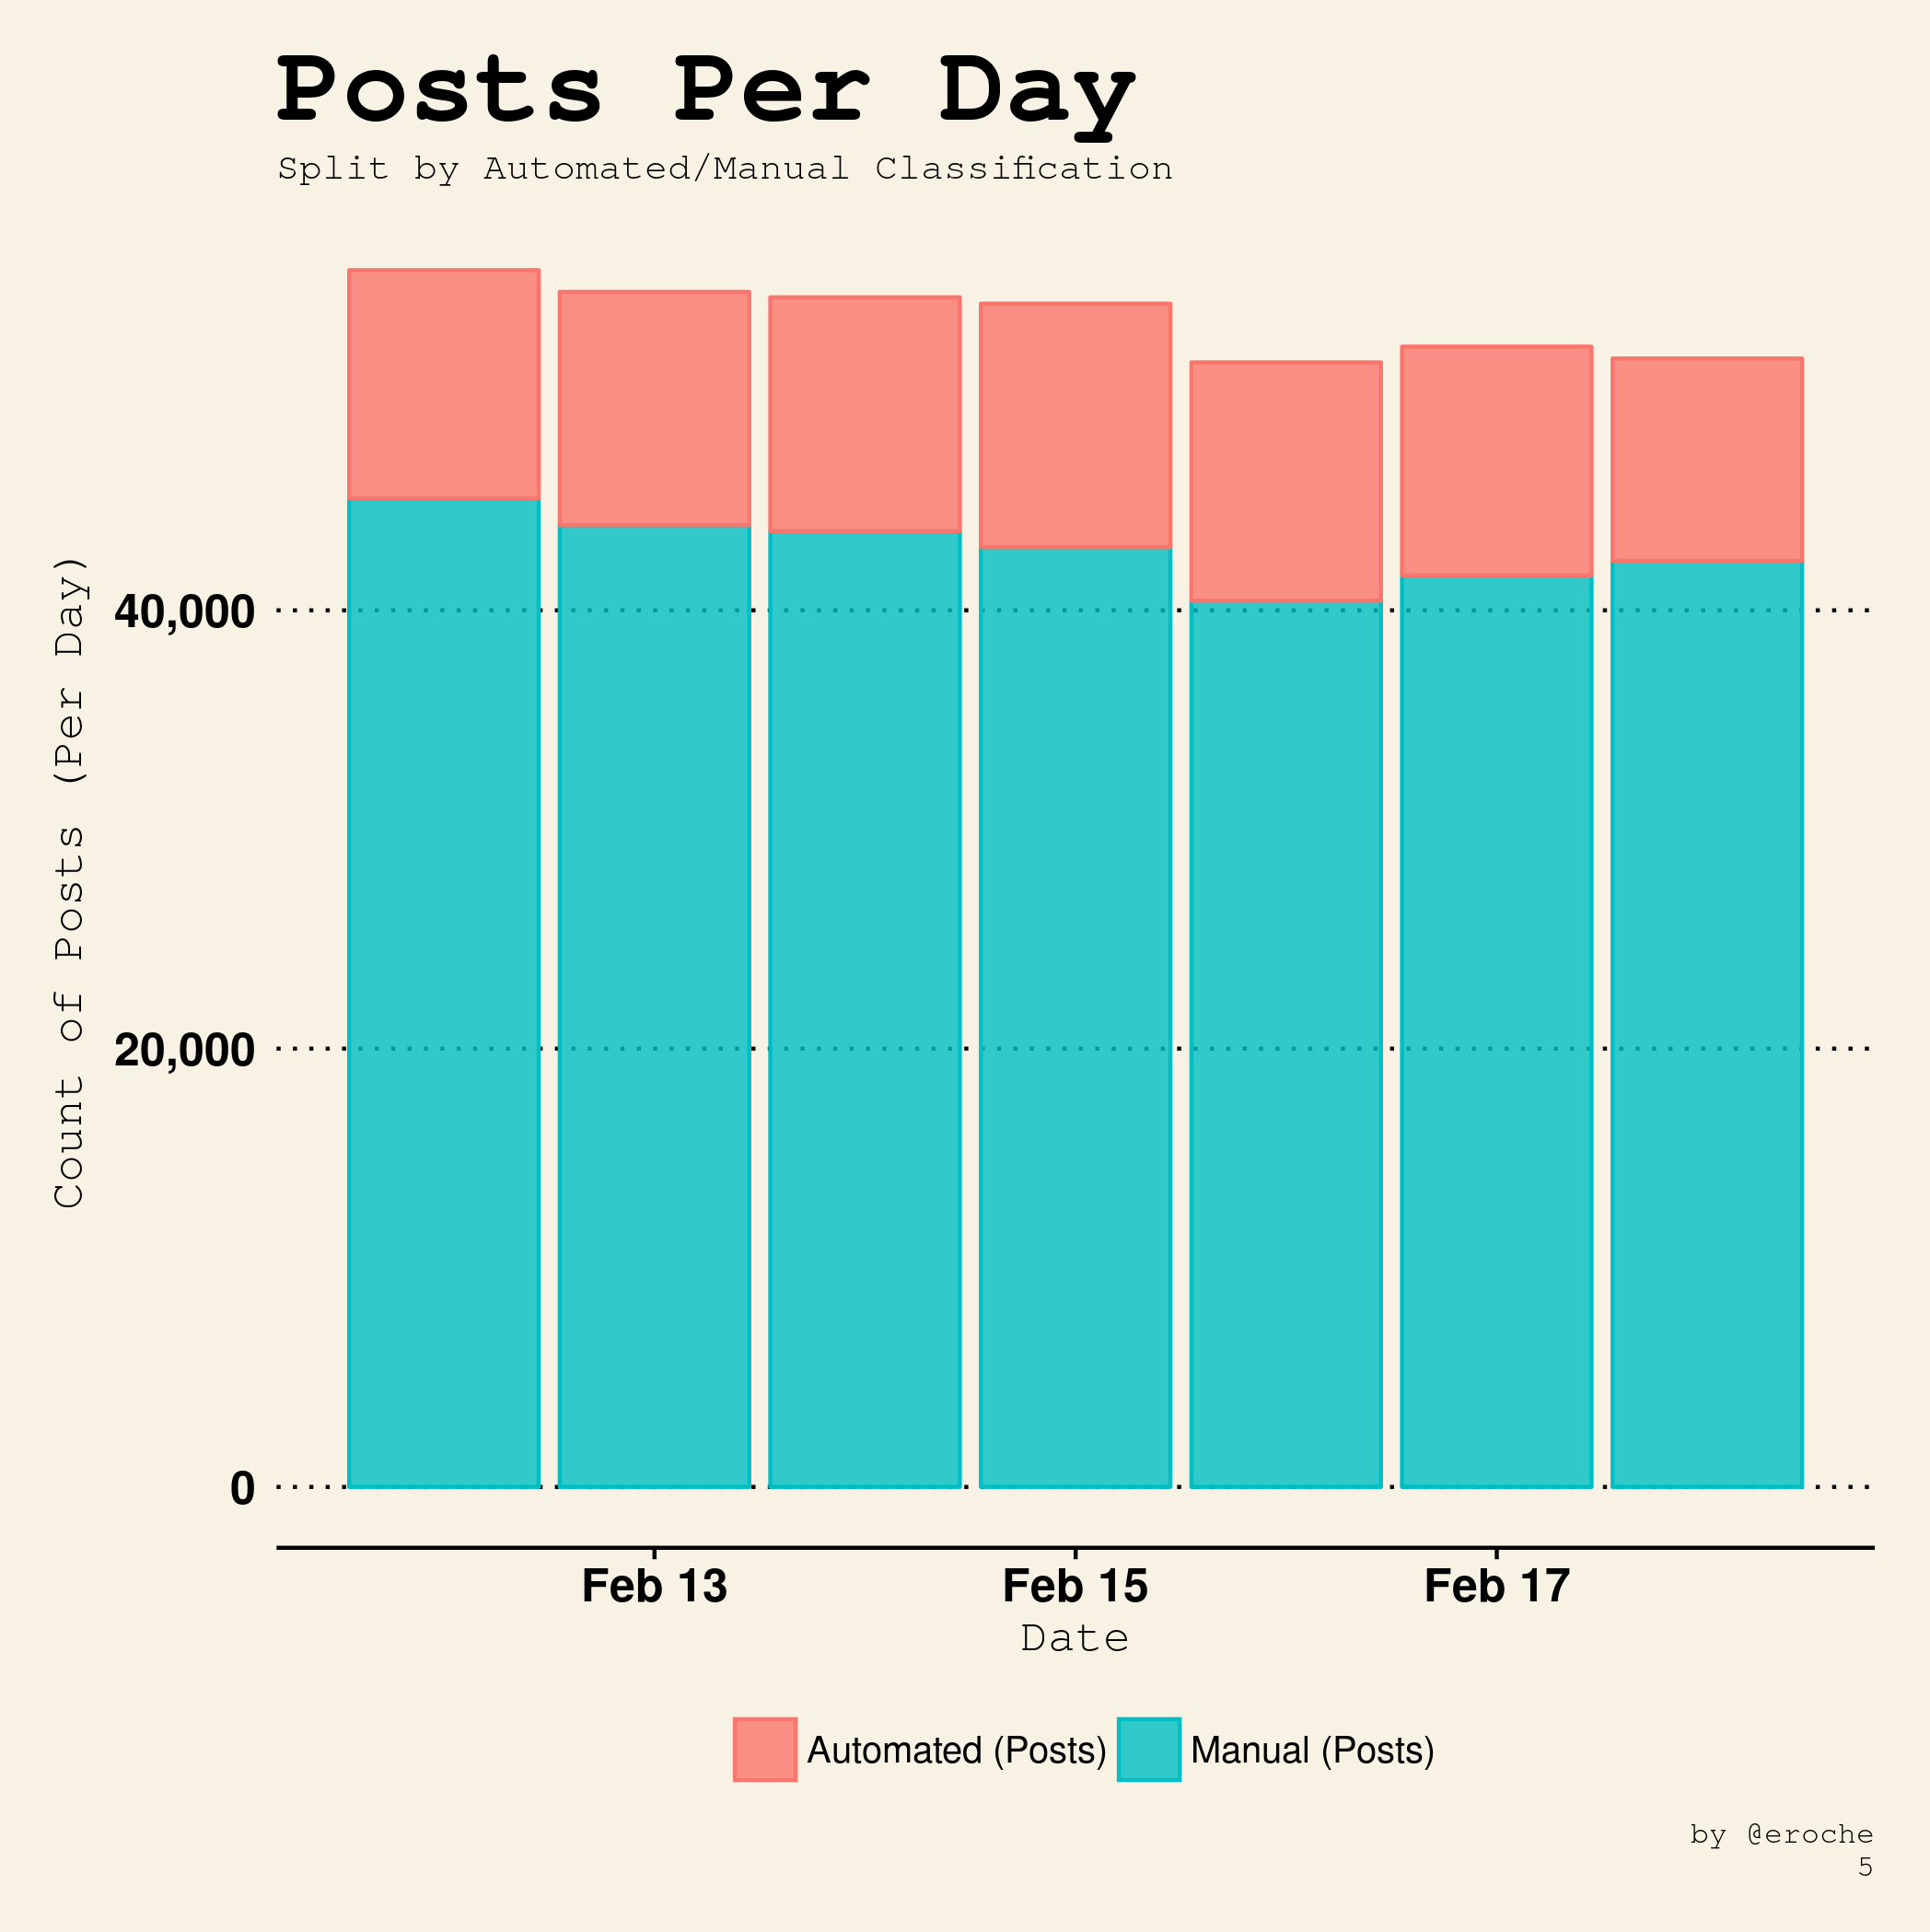
Posts per Day (ex comments)
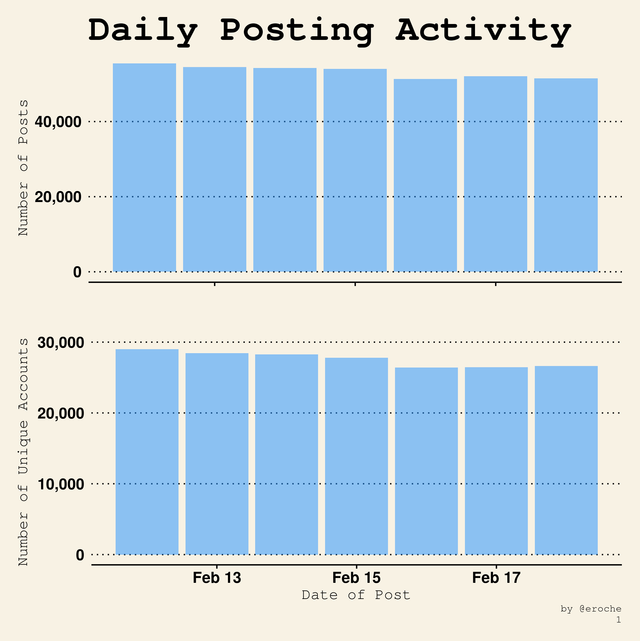
In the past 7 days there was a total of 373k posts from 63k unique accounts, up from 347k and 61k last week.
This week we get an average of 5.9 posts in the week for authors that were posting.
- The mean number of Posts per day was 53k, up from 49.5k last week
- The mean number of Accounts posting per day was 28k, up from 26k last week
Daily counts give a high level overview but we can examine subdivisions or groups of authors to get further insights into who is posting.
The colour in the following graphs represent different cohorts of Steemit Accounts.
Reputation
It can take a while to build your reputation and the system is designed so that it is easy to lose it. You don't want to get downvotes from people with higher Rep!
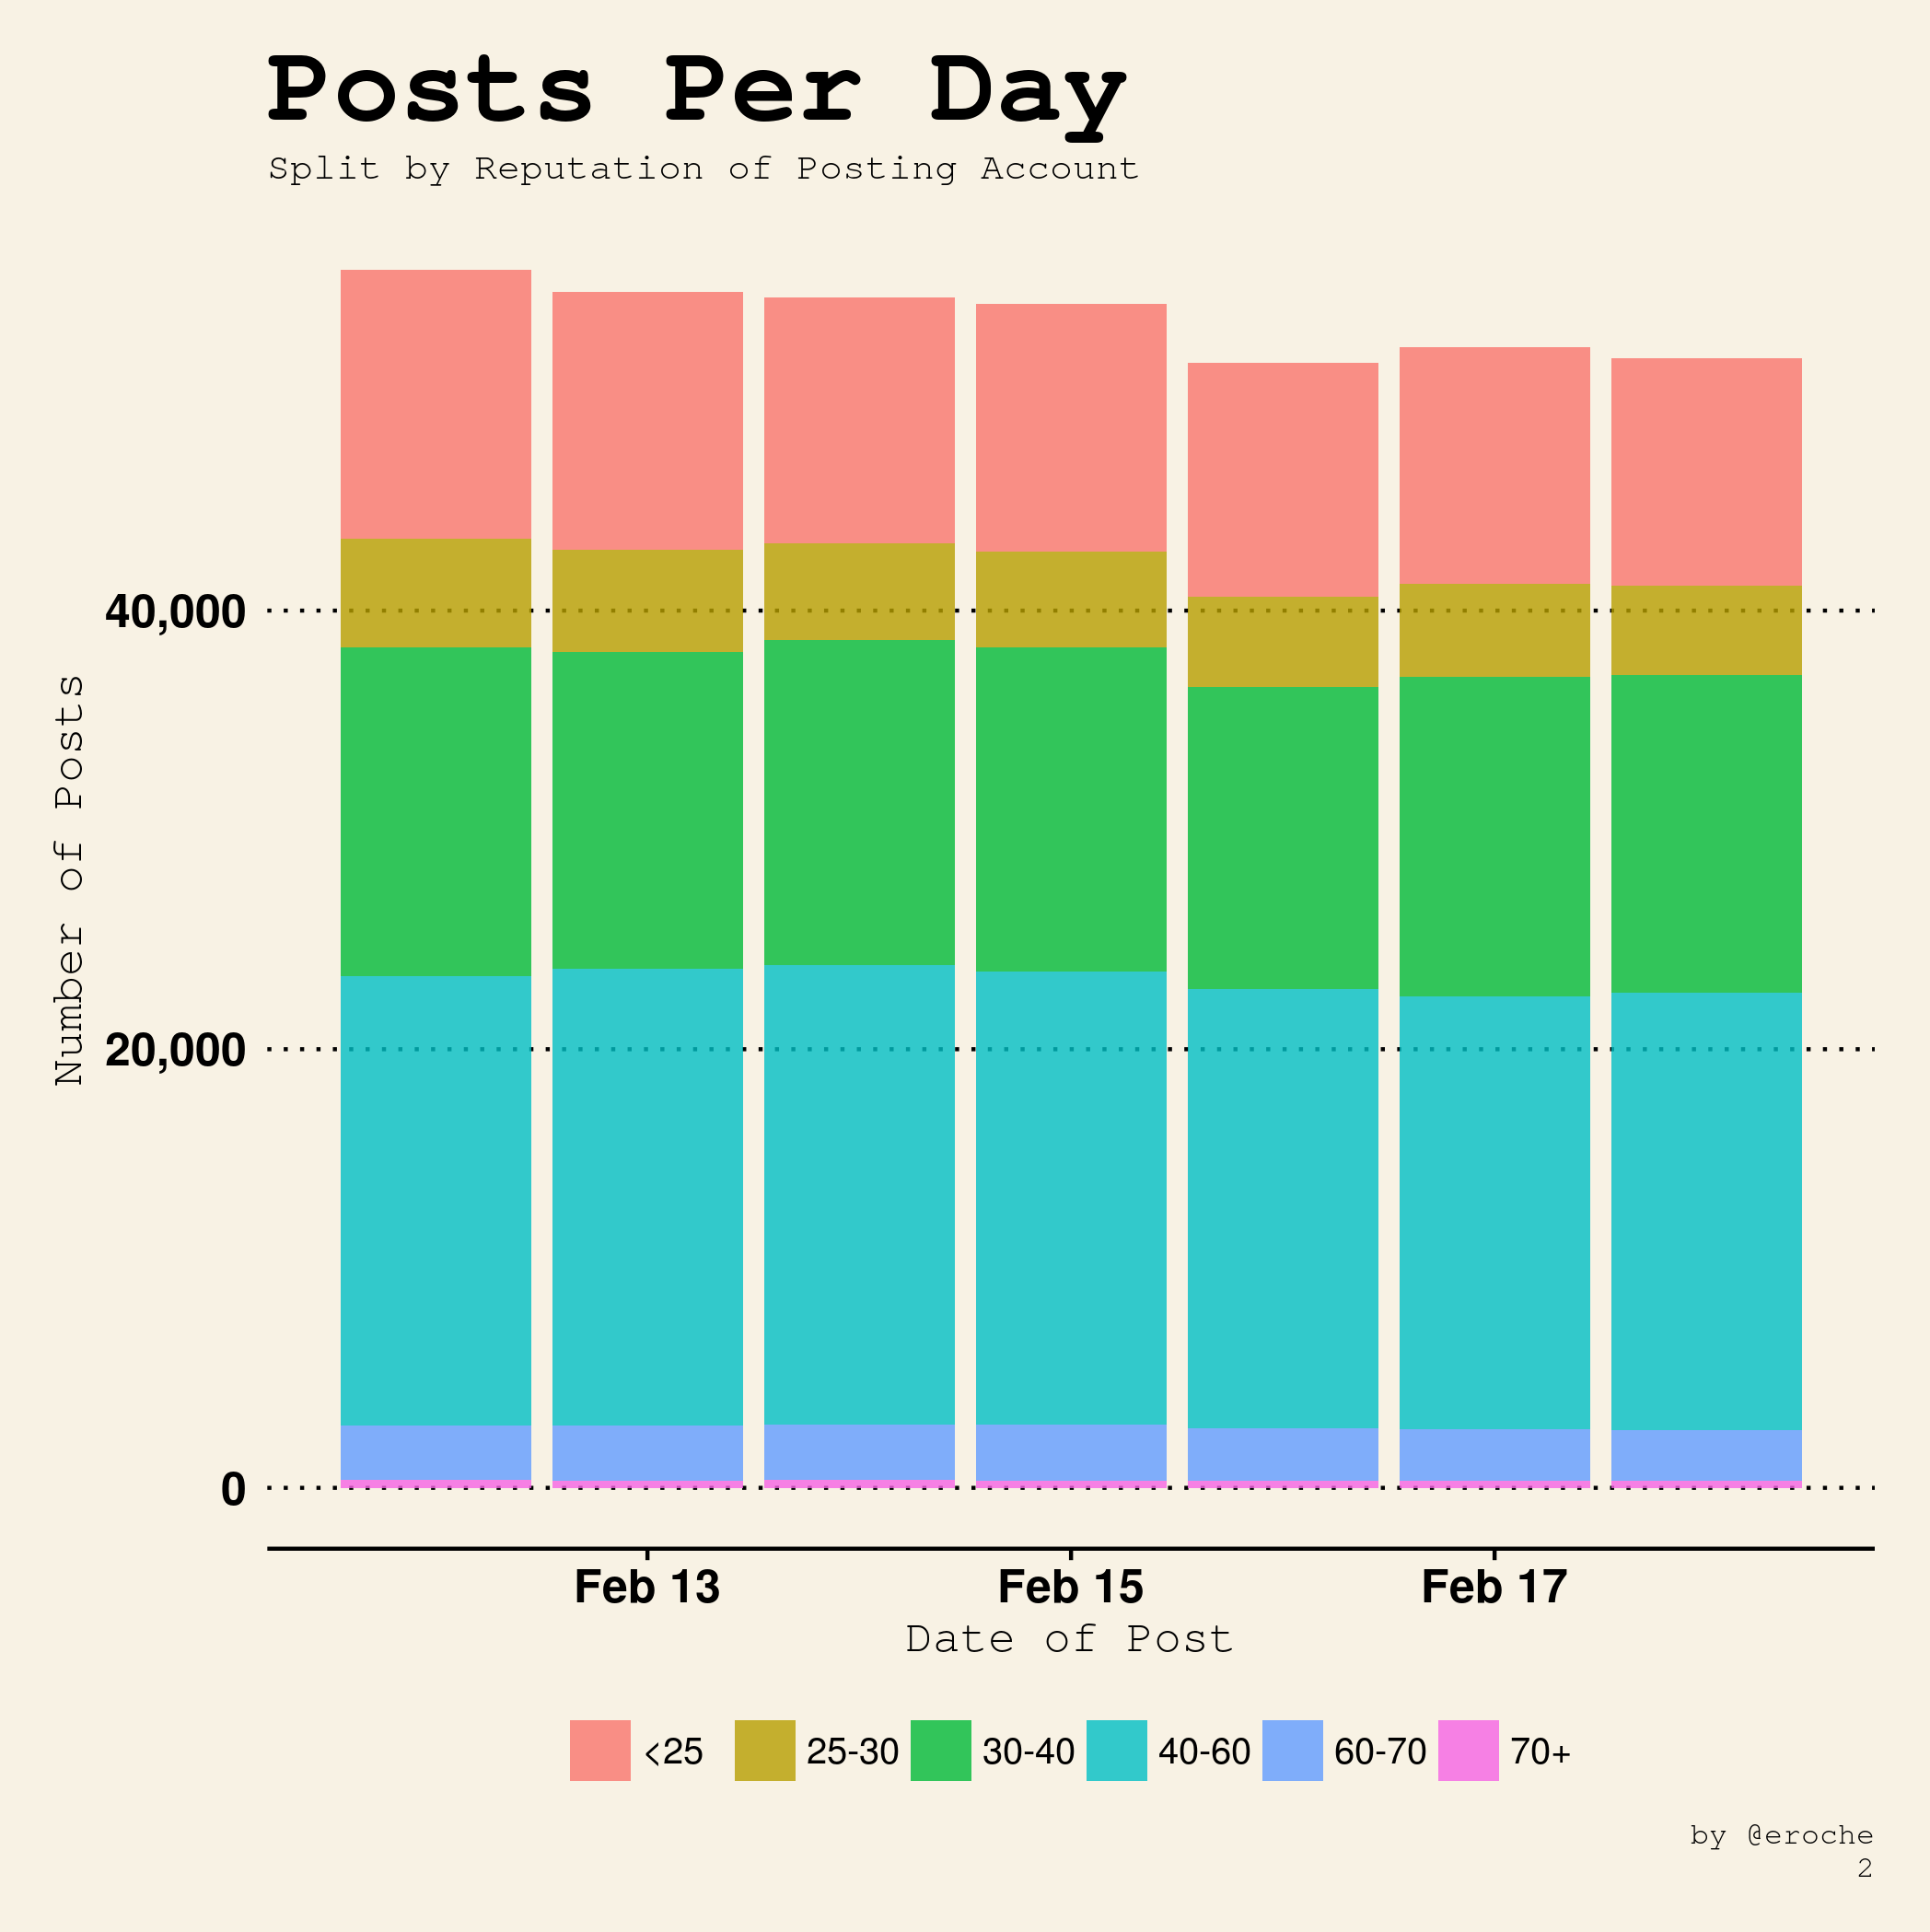
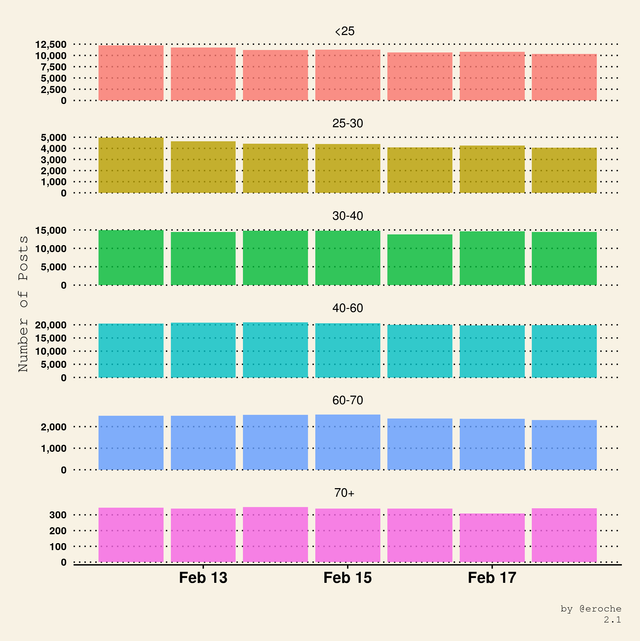
The next few graphs examine how many posts per day are made by people of different Reputations.
Total
Breakdown
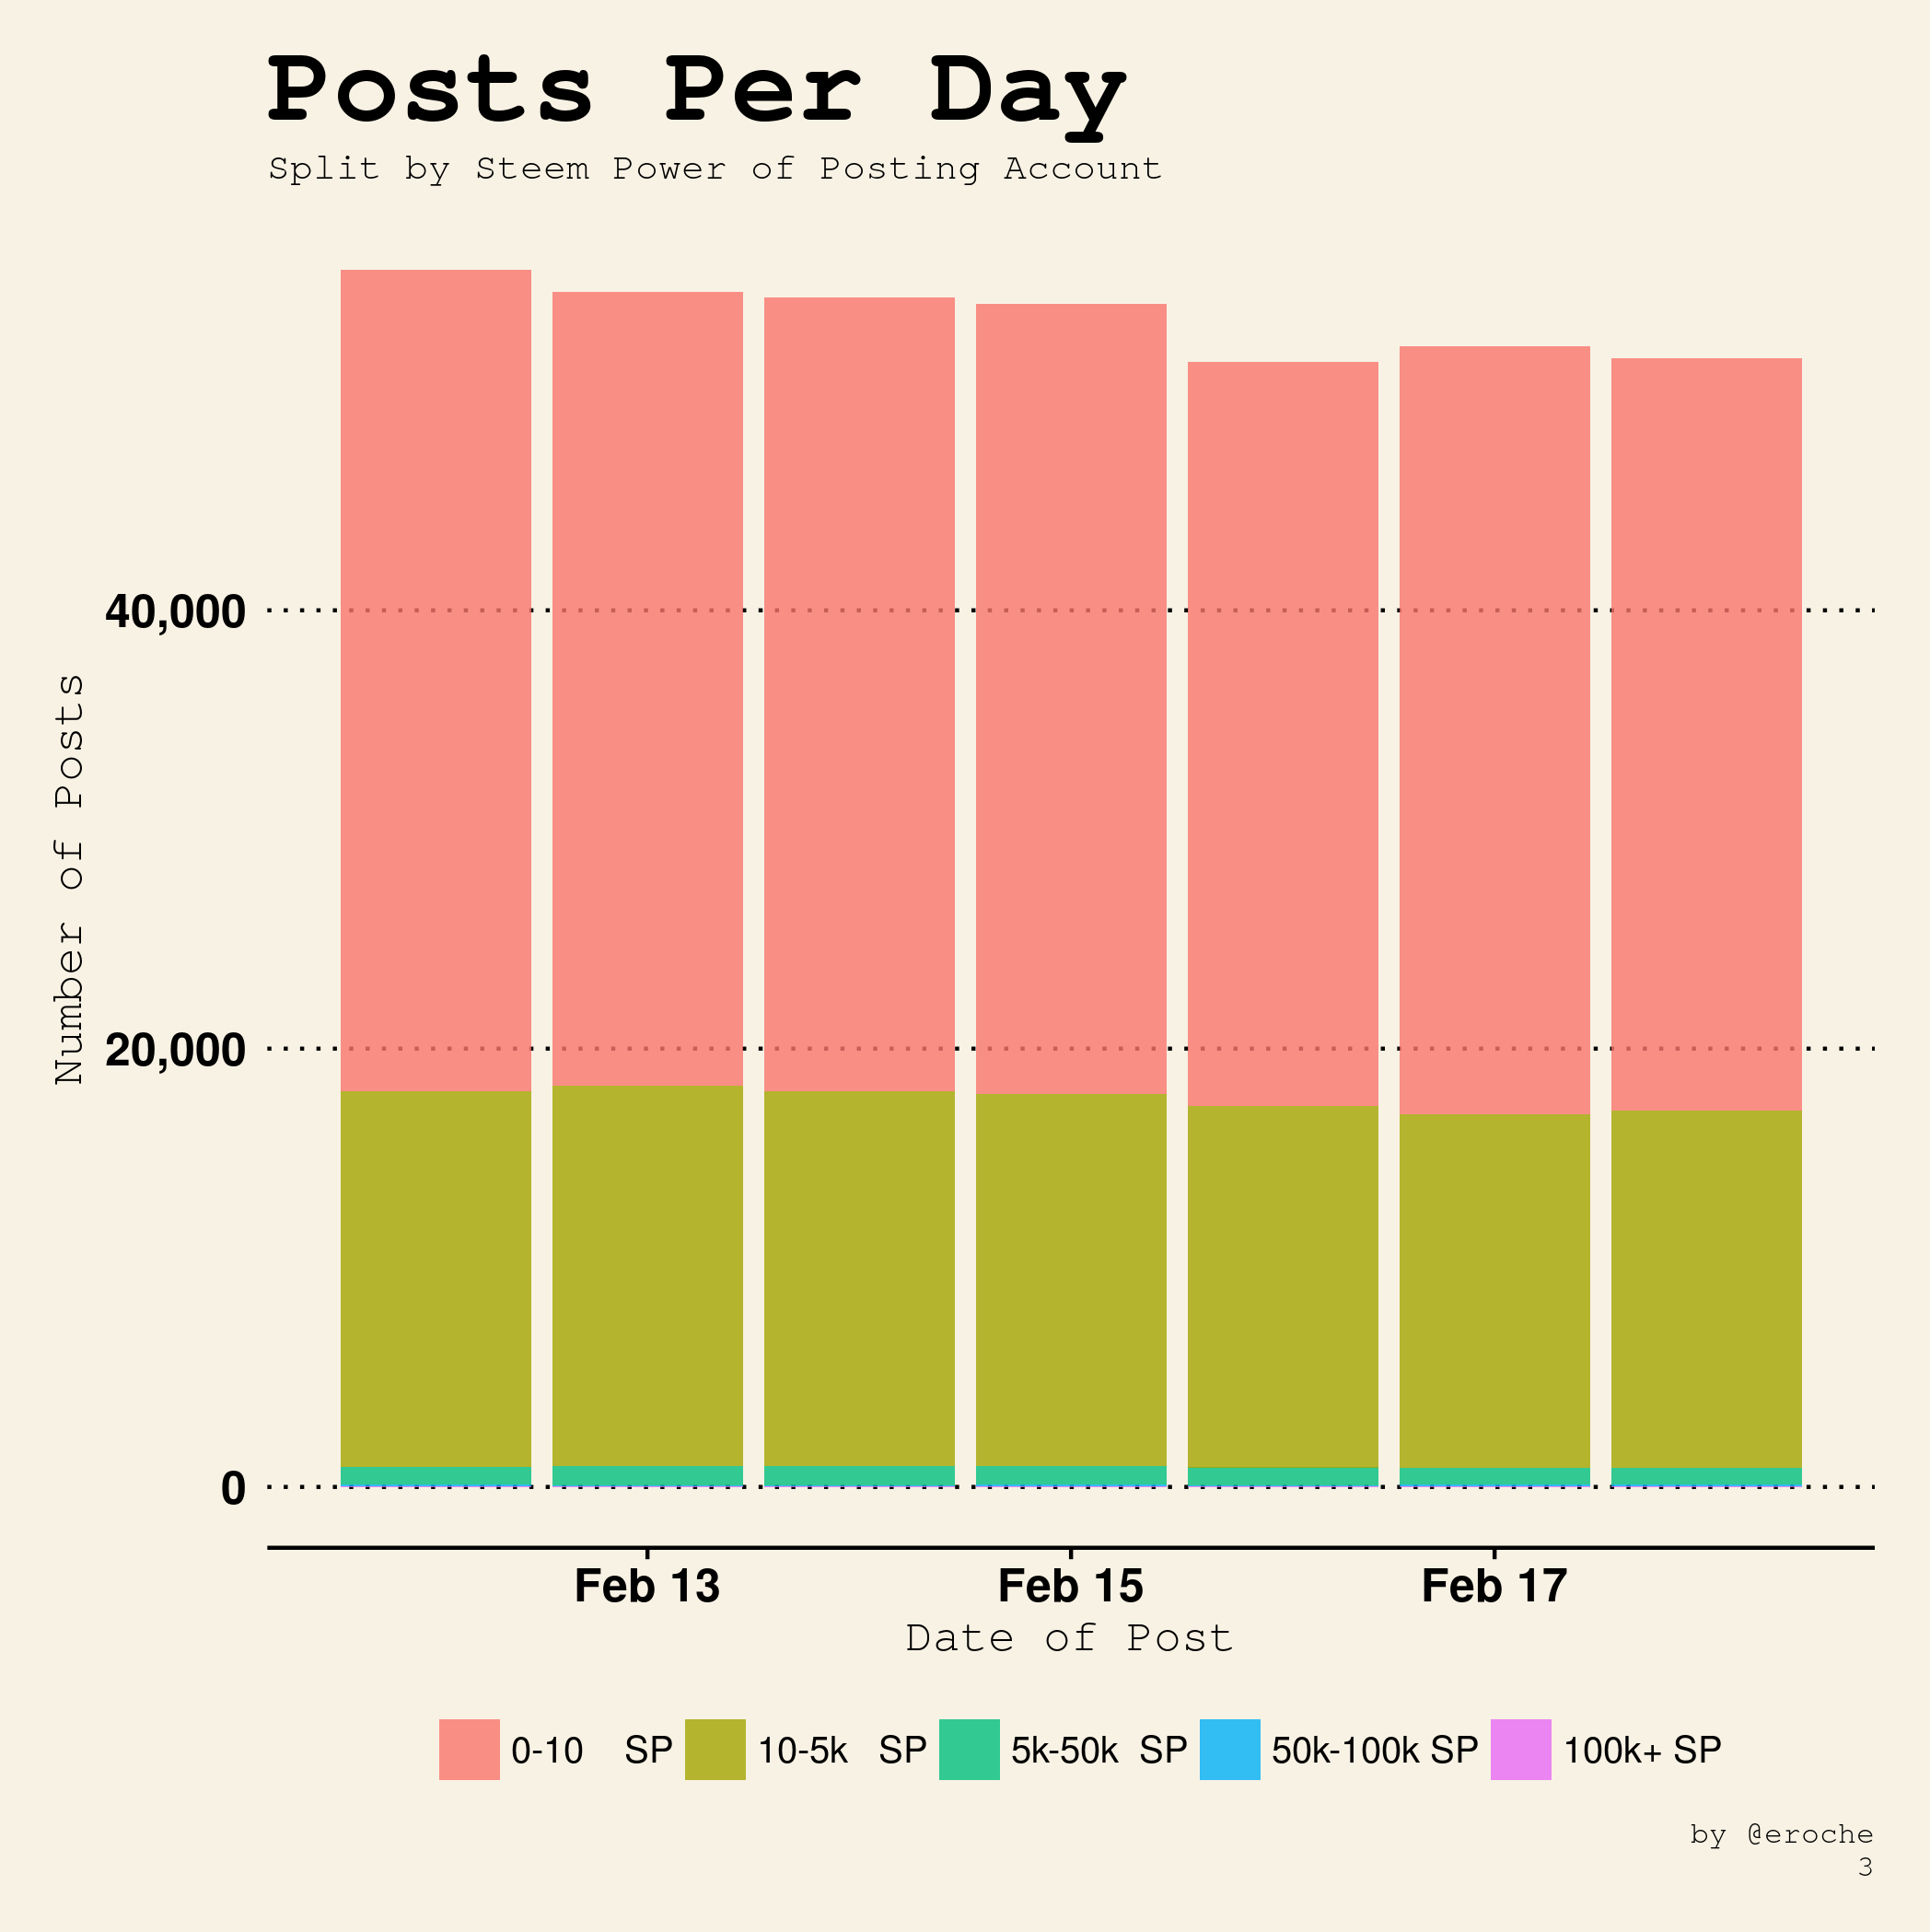
Steem Power
Steem is a stake weighted platform. If you have more stake your vote is worth more.
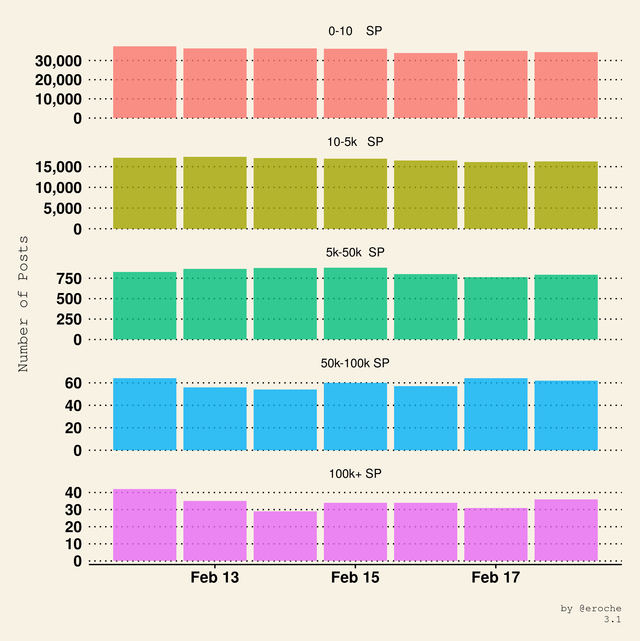
The next few graphs examine how many posts per day are made by people with different levels of Steem Power.
Total
Breakdown
Account Duration
The first accounts were created in April 2016. We are now past the 700k account mark. Absolute number is important but retention is also important.
- How many people who joined over the course of the last year are still posting?
- Who is creating the bulk of the daily content?
The next few graphs examine how many posts per day are made by people that have been on Steemit for different lengths of time.
Total
Breakdown
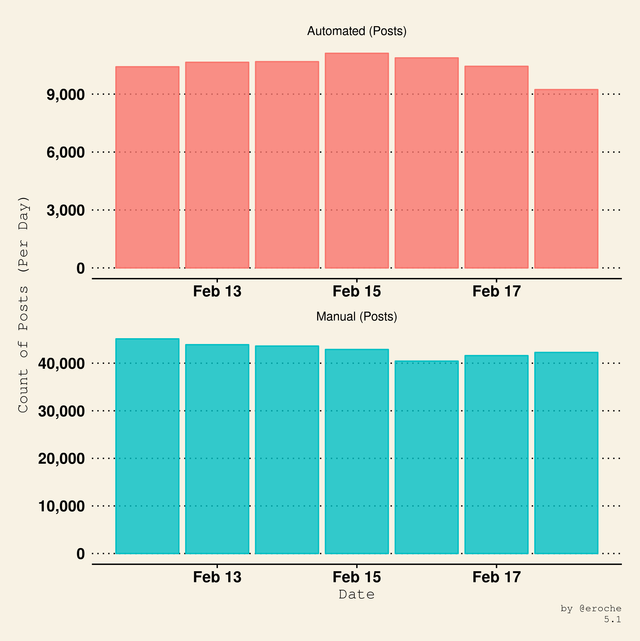
Automated Accounts
If there is one, what is the number of comments a day that we could use to identify automated accounts?
I would propose anything higher than 4 posts per day (on average) uses some sort of automation. This number may not be correct but it's a starting point for our analysis.
Automated accounts may post daily reports or in some cases may just be people spamming the system with low quality content or content copied from other sources. Not all automated posts are bad and some provide a useful function such as daily statistics, market analysis etc. Splitting out these automated accounts will be more relevant for comment activity however it's also worth tracking for posts.
The next few graphs examine the daily posts that are in some way automated.
Total
Breakdown
It is useful to look at numbers of posts on a daily basis but aggregating over a longer period gives us additional insights.
Posts per Week
The remaining graphs examine the posting activity over the last 7 days in aggregate.
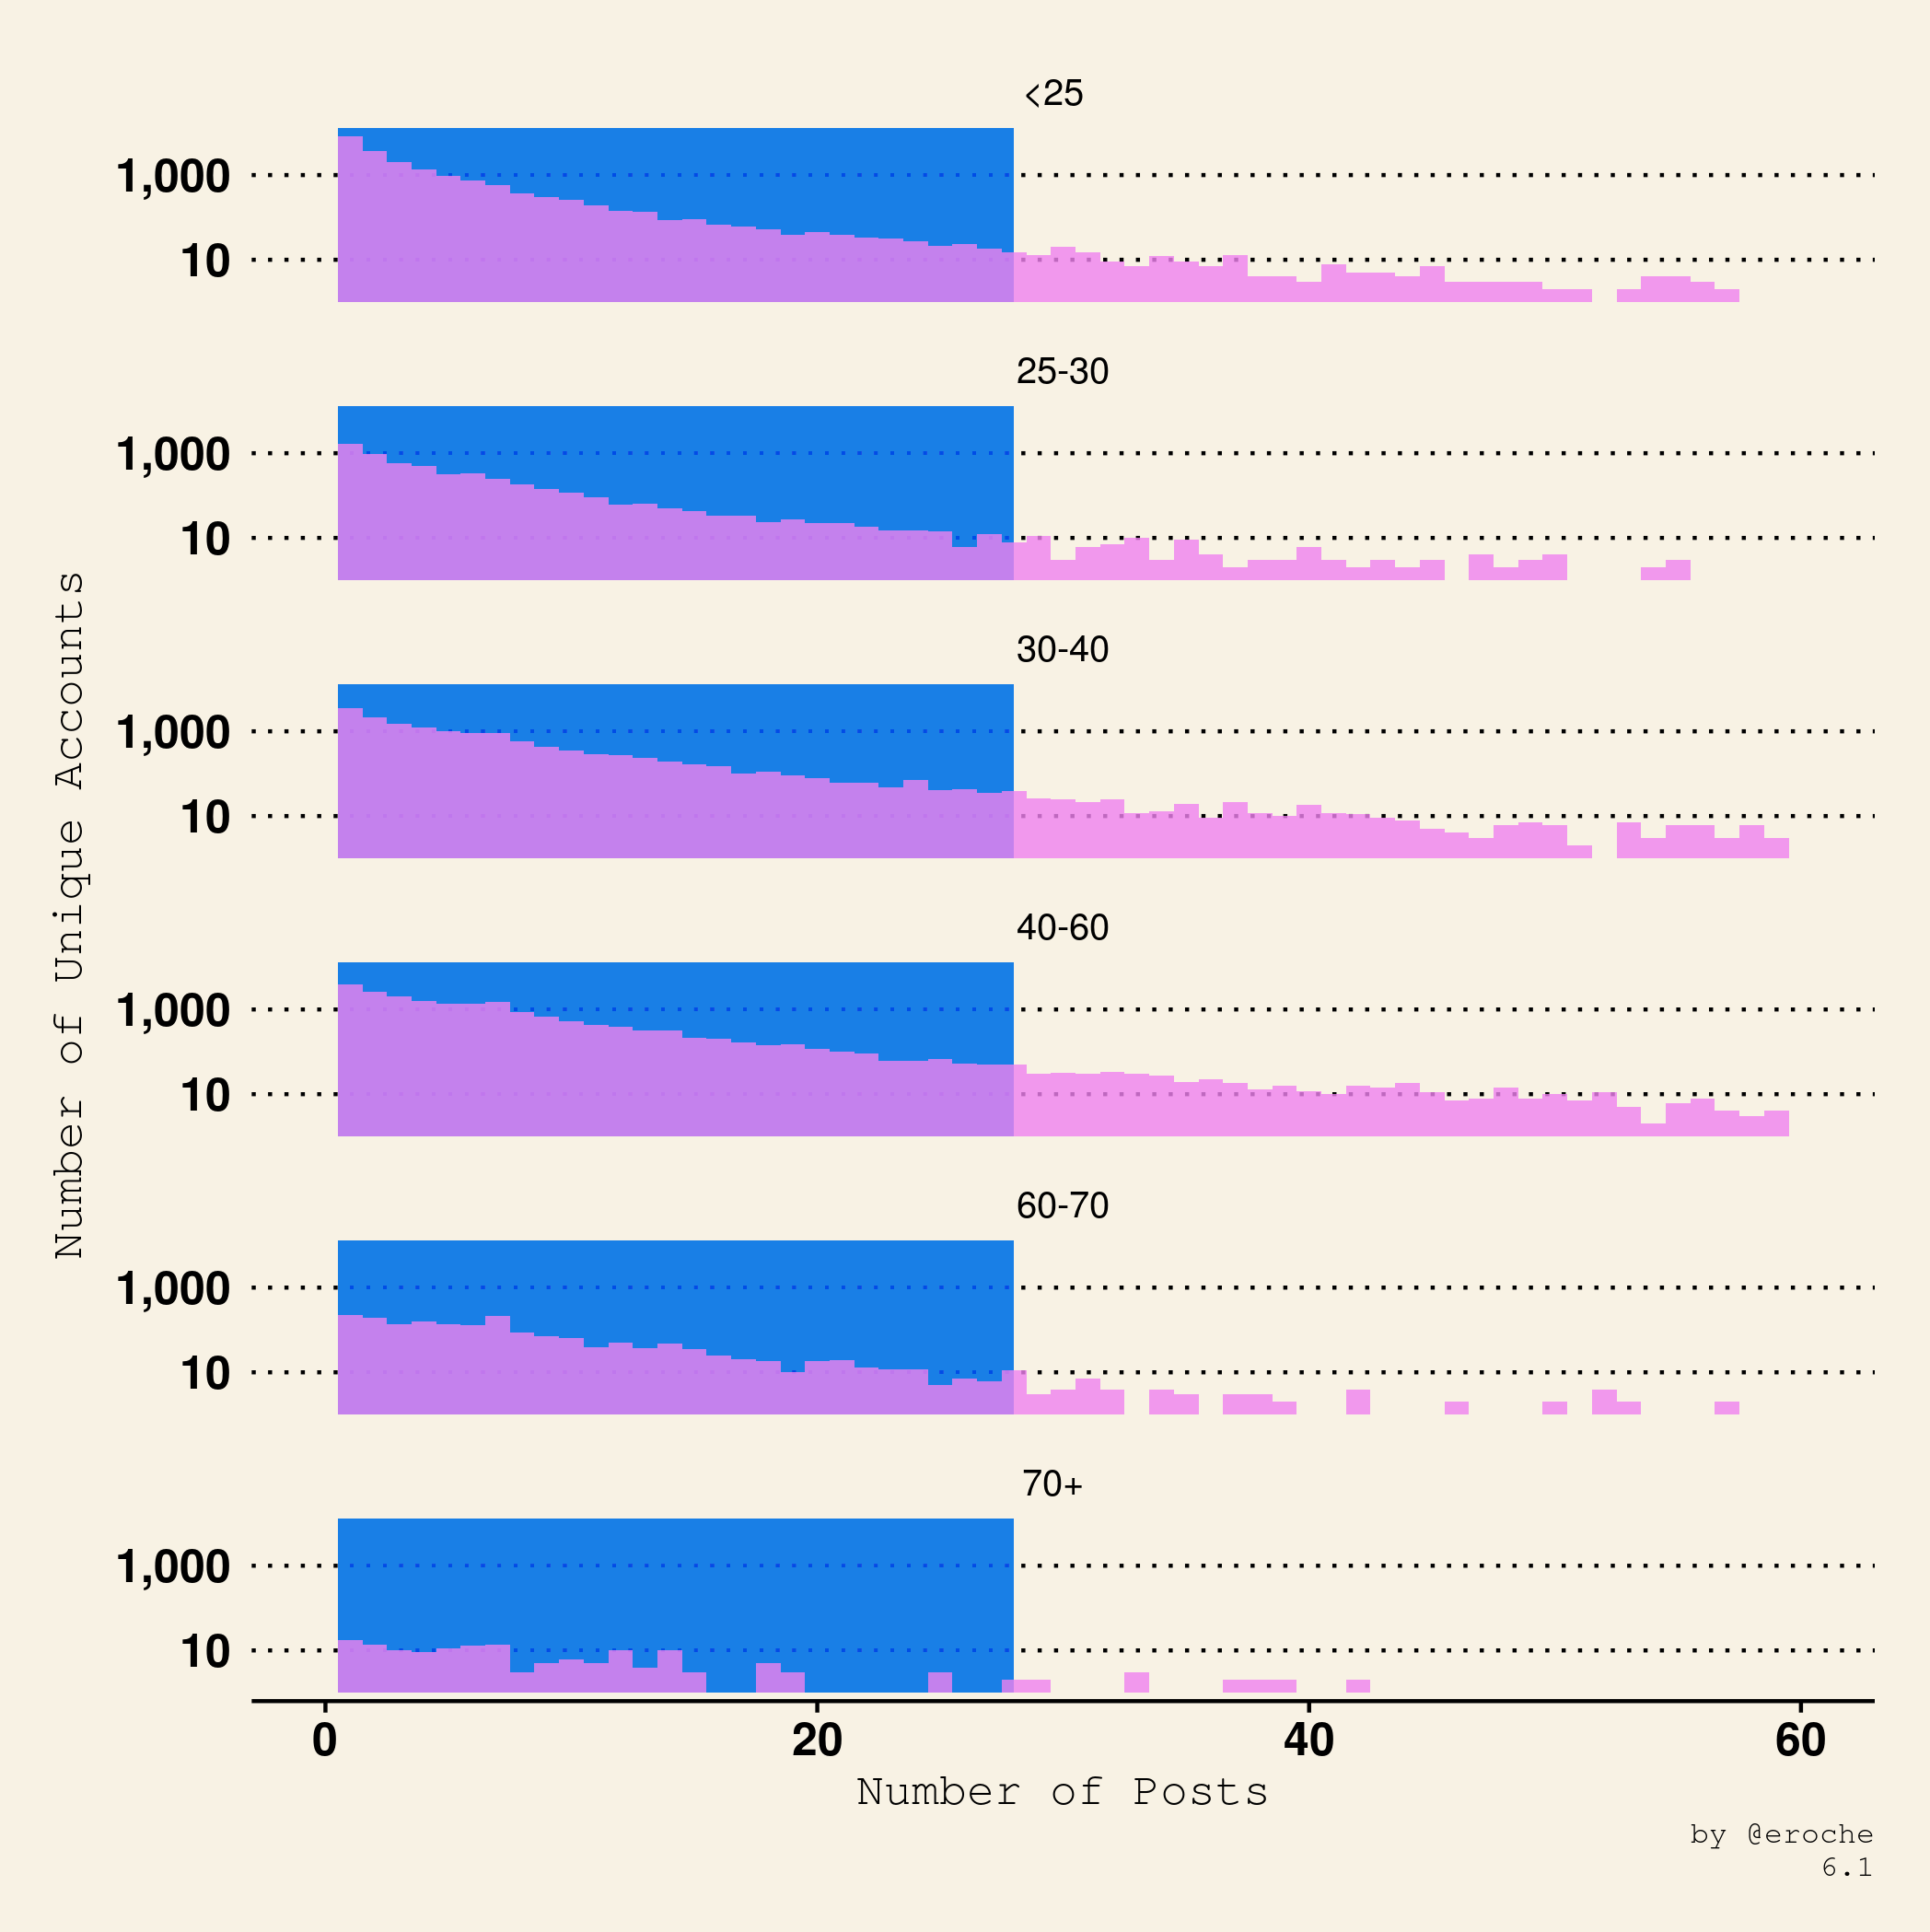
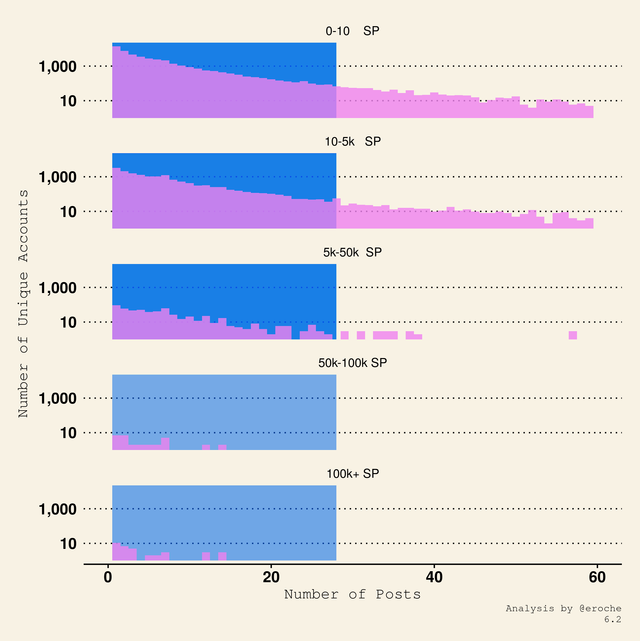
Posting Frequency
The number of posts for individual accounts plotted versus the number of unique accounts shows how frequently accounts are posting.
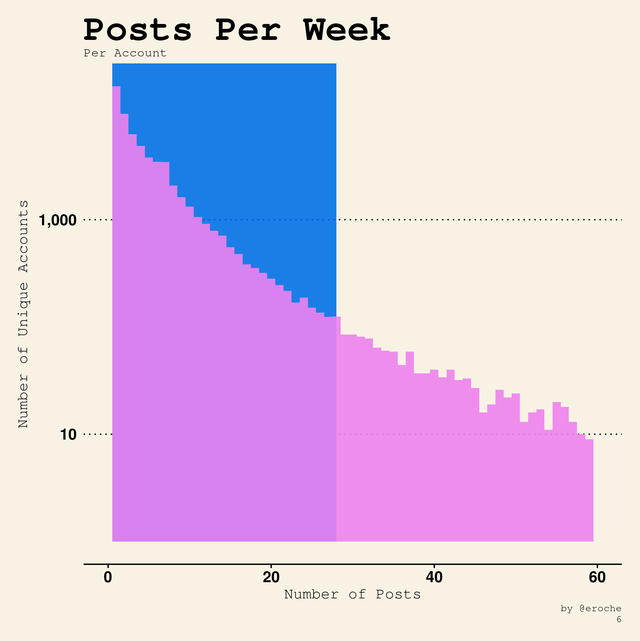
- The blue shaded area represents less than 4 posts per day (on average).
- A large number of accounts post less than 4 posts per day.
Let's examine the breakdown of this frequency by the categories we have looked at before.
Reputation
Steem Power
Duration
Related Content
If your looking for more daily statistics:
- @arcange produces daily reports with really useful data.
- steemdata.com, a website by @furion, has live interactive charts
- #blockchainbi and the members of the @Steemitbc community, spearheaded by @paulag, produce detailed analysis on all things related to Steemit.
This Posting Activity Report is published on a weekly basis
- What area of this report did you find most useful?
I would love any feedback to improve or clarify any of this analysis.
Previous Posts
- https://steemit.com/stats/@eroche/posting-activity-report-5th-feb-11th-feb
- https://steemit.com/stats/@eroche/post-payout-report-5th-feb-11th-feb
- https://steemit.com/stats/@eroche/steemit-twitter-activity-feb-9th-feb-15th
Thank you for reading this. I write on Steemit about Blockchain, Cryptocurrency, Travel and lots of random topics.

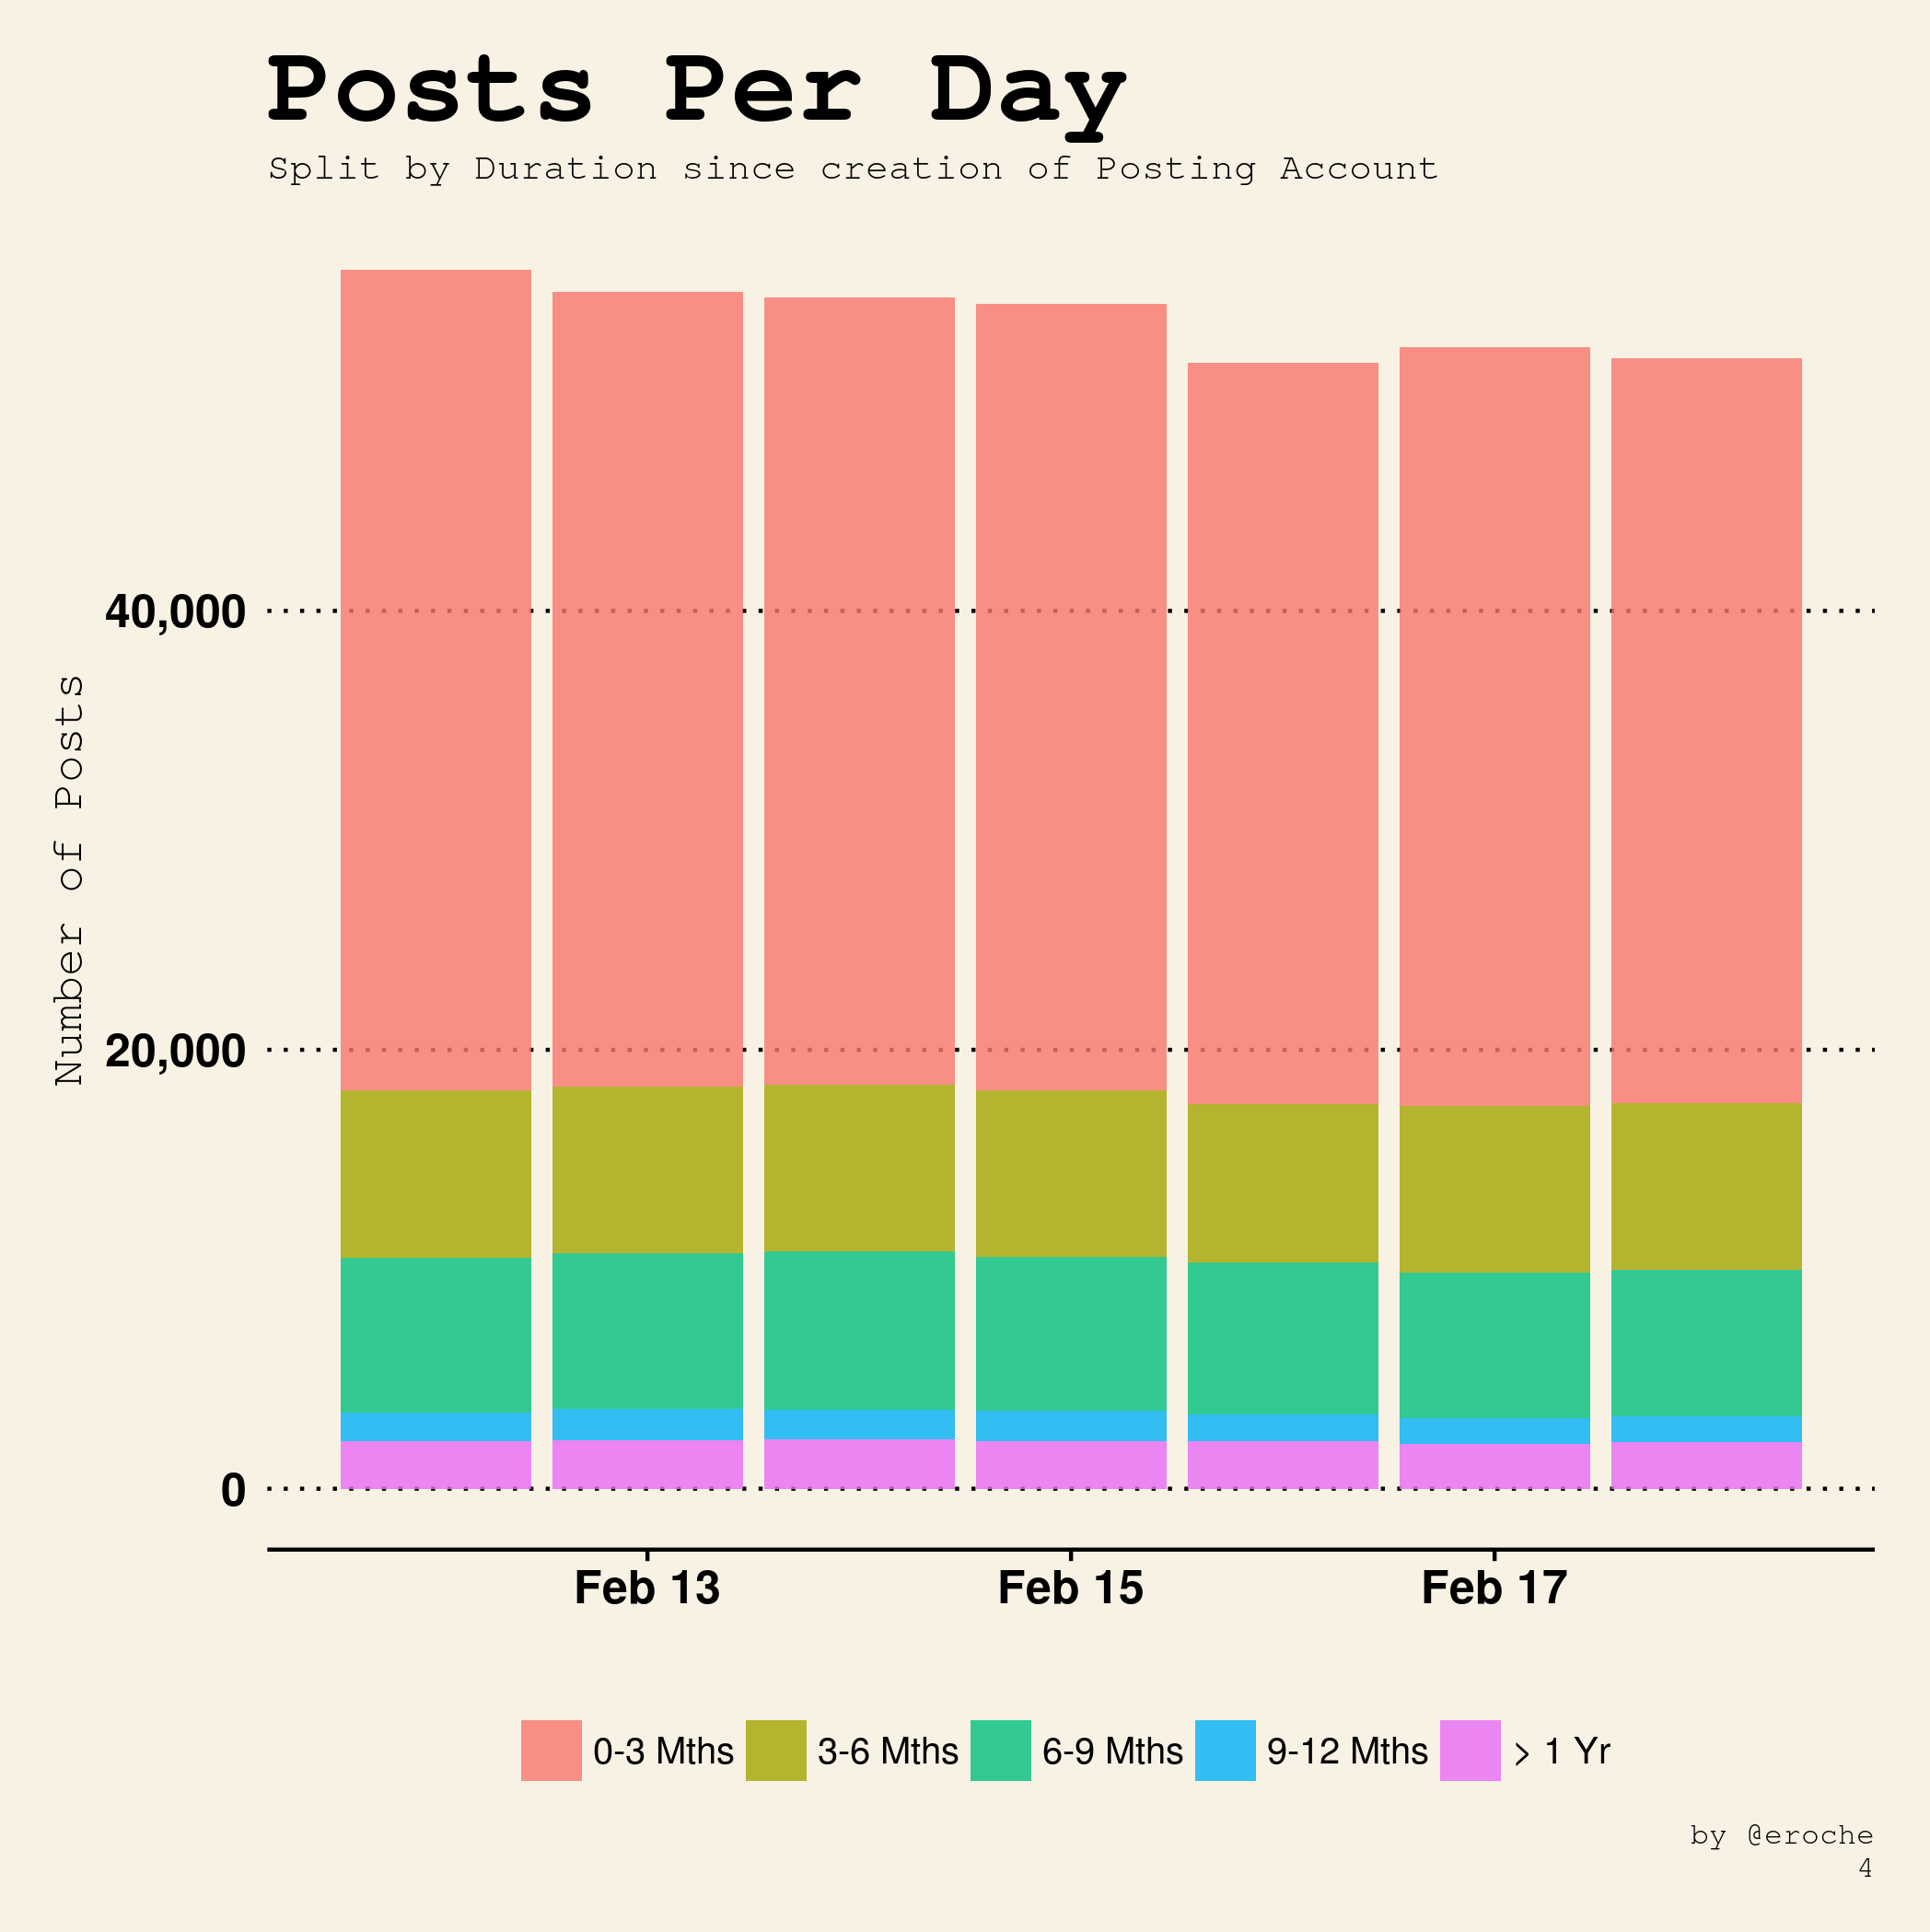
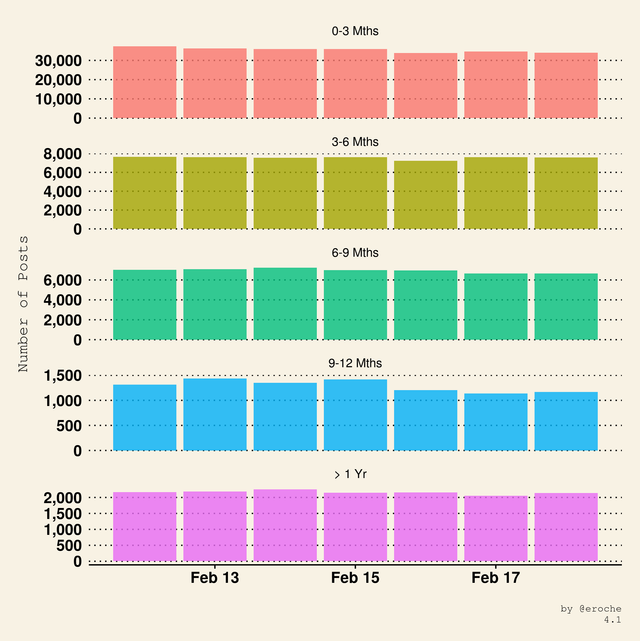
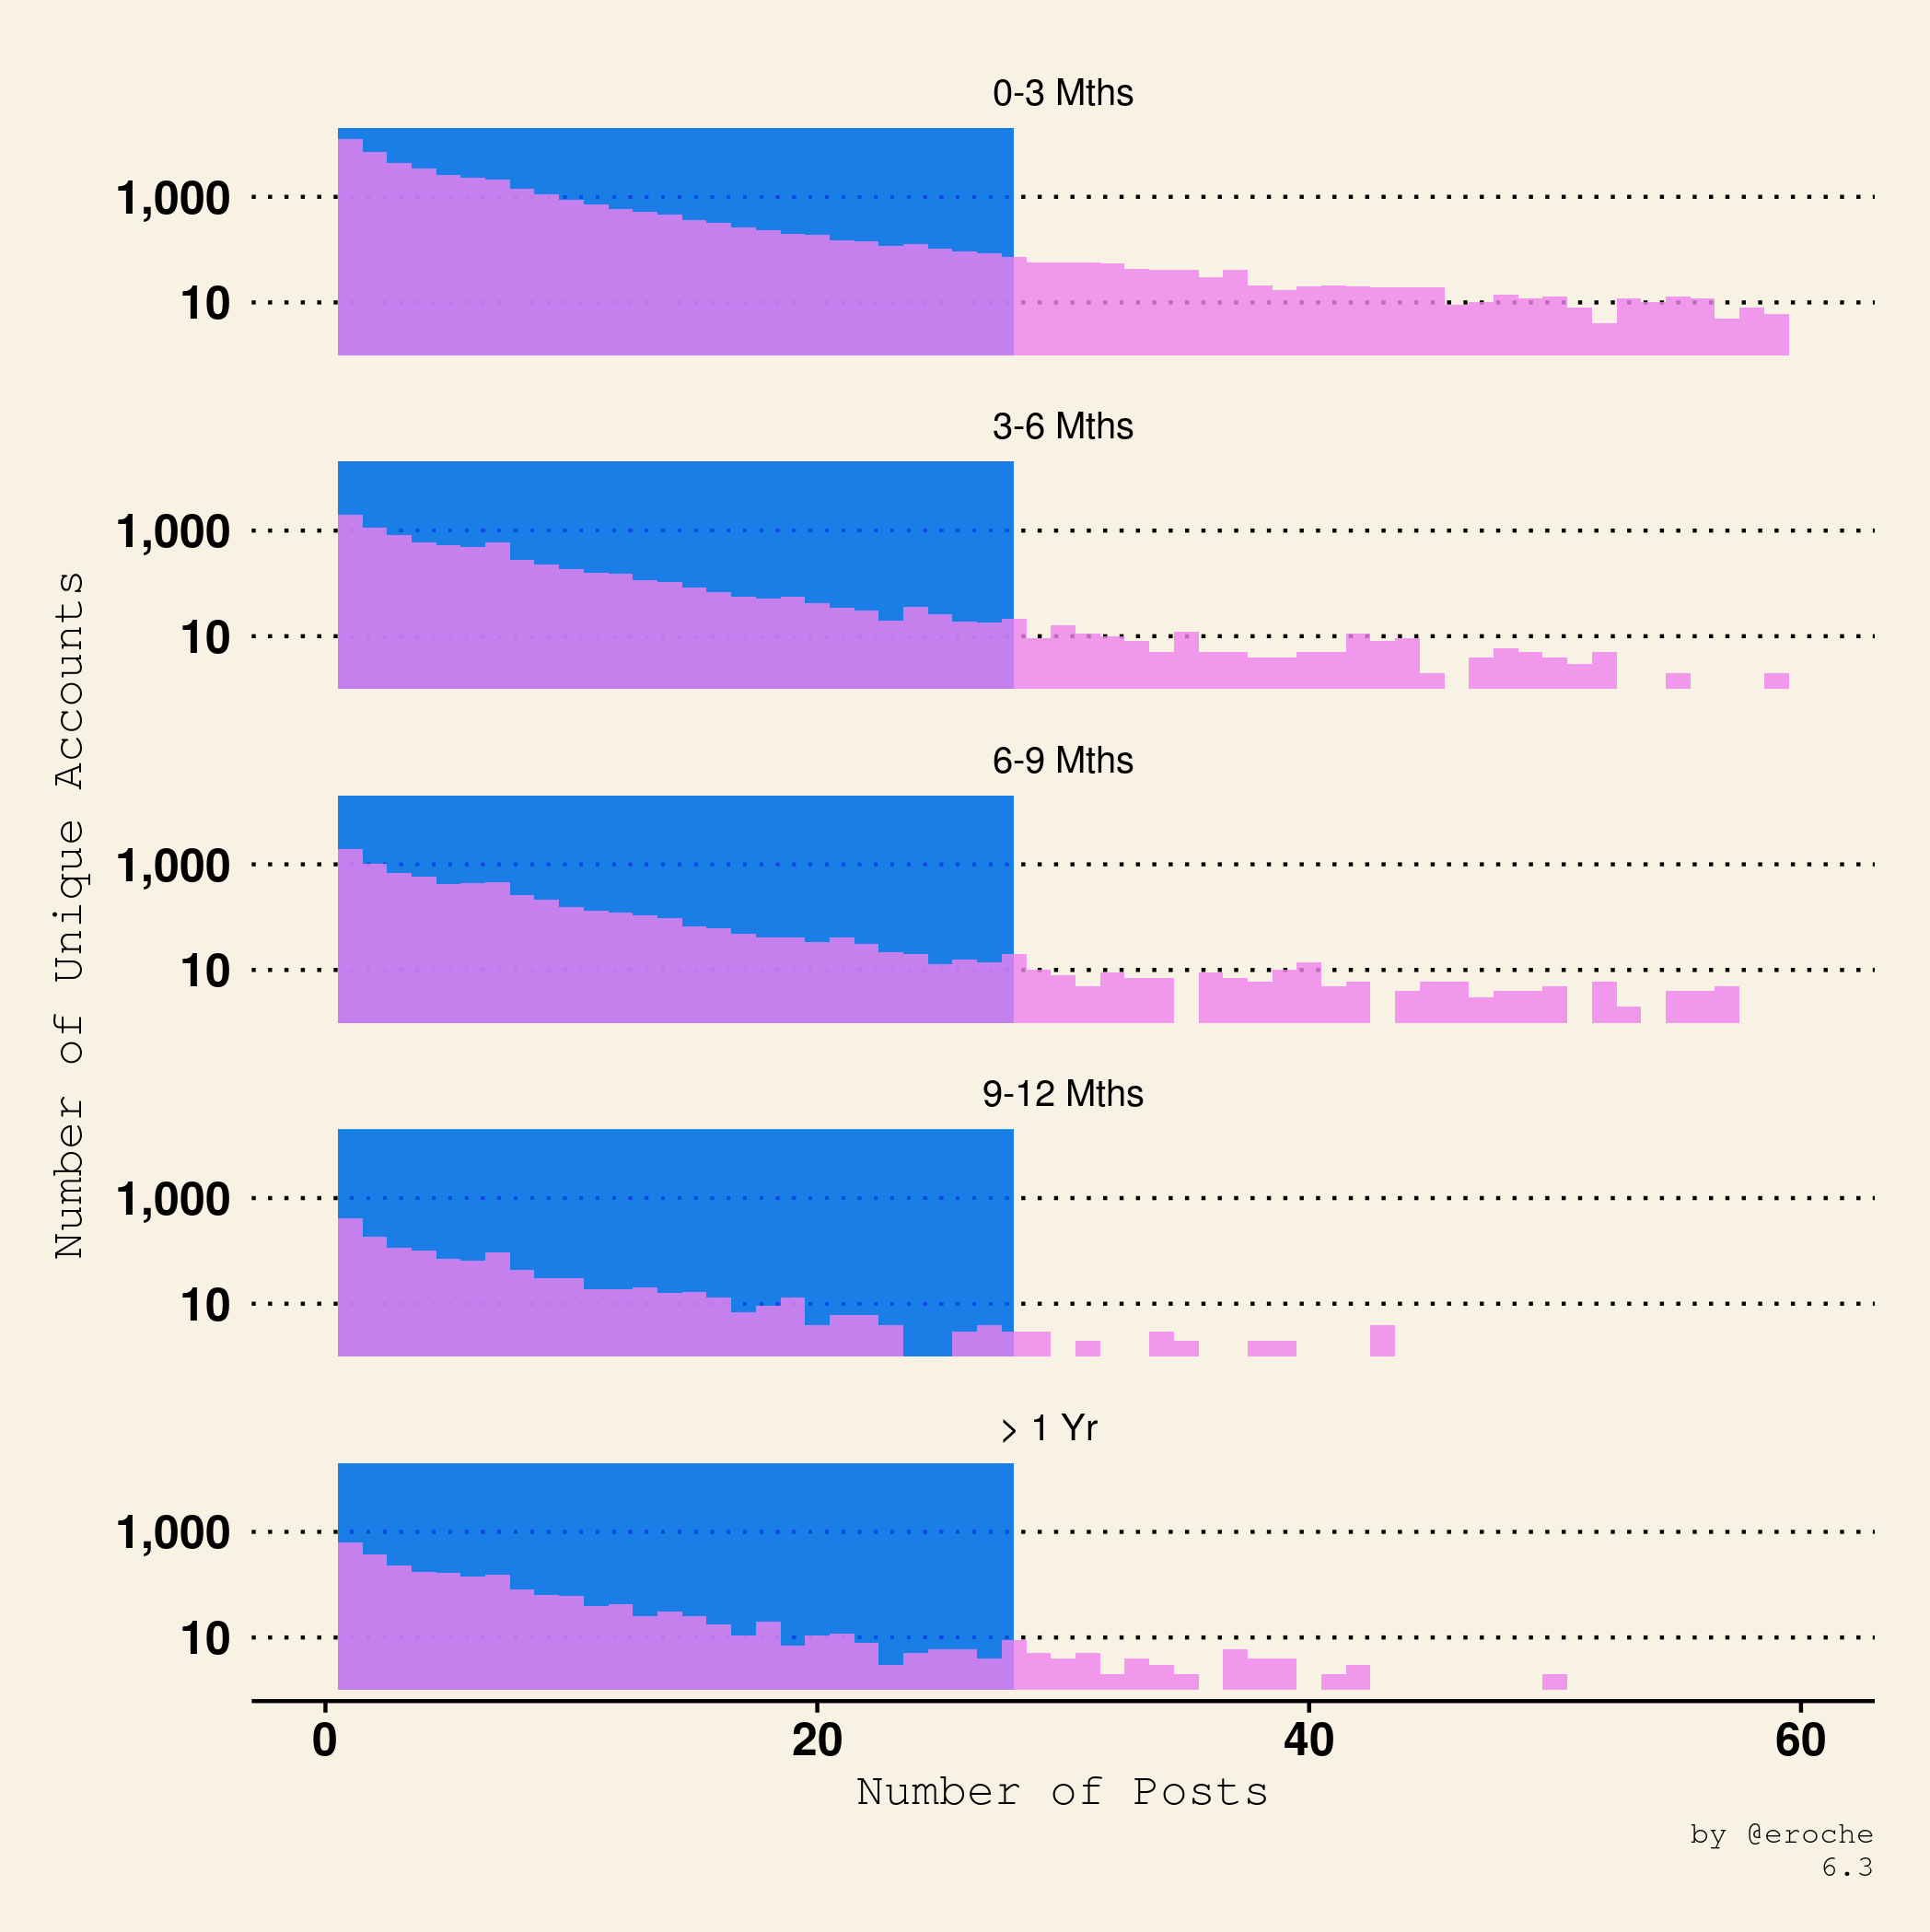


In account duration, dose really mean the longer you are in steemit the less post you post weekly
There are two reasons for this:
and
informational post one of my friend account are stuck and waiting for approval!
thank you @eroche!
the above stastistics shows that steemit is growing day after day and this is good for the community
the above stastistics shows that steemit is growing day after day and this is good for the community
Steemit hold a good community. So It will be grown. Other fact people are very helpful here. Supporters are very kind. I did not know details about the statistics of posting. Thanks for sharing the informational blog.
So it's growing week by week, and this is good news! New accounts are obviously contributing a lot of content, and this is how it's supposed to be. They're working hard on their rep while scouting the new territory... however most of them don't get much in terms of financial reward, which often leads to an abandonment of the platform caused by disillusionment... but the strongest survive.
It's a layered picture, but pointing at growing momentum, isn't it?
this is a amazing post.. and very informative post. thanks for sharing.
A very interesting statistic. Newcomers are especially active. At the beginning of the journey it is important to set the right tone, become noticeable here. Most importantly, these posts were not rubbish. Recently I read an article about our platform. It says that it Steemit cluttered with garbage of low-quality content. And that's kind of true. I sometimes see such ridiculous messages that I feel shame for such authors. But also there are a lot of interesting works of high quality. Some articles are just great, reading such works is a great pleasure. I would like that each participant was aiming to create interesting and thoughtful posts. Then Steemit will really become a unique place on the Internet, without garbage, rubbish and absurdity.
I completely agree, and I hope to see soon apps that filter out that garbage.
hi @eroche, great analysis, and nicely drawn charts. Of big enthusiast of data analysis and your post made me start asking myself more questions about what else can be done with steemit data. Thanks for sharing.
Cheers, @davidfumo
Thanks David. The Blockchain is a very rich source of data for analysis.