Monitor your SmartCash SmartNode v2.0 (VPS on Digital Ocean)

Monitor your SmartCash SmartNode v2.0 (VPS on Digital Ocean)
Mac 10.13.2 (Local Wallet)
Ubuntu 16.04 LTS x64 (VPS smartnode)
VPS on Digital Ocean
Date 29/1/2018
By @controllinghand
Donation to my Smartcash: SebFkuHrqDnj3obXvMtfxtQKRgFeVpXF5x
Digital Ocean referral link https://m.do.co/c/4f0c81328877 Free money $10 credit
Introduction
Welcome, you are probably here because you have just finished installing and configuring your SmartNode/s? And you have already secured your SmartNode? Plus, you have backed up your wallet? If you can say yes to all of these then you are in the correct place.
Why is it important to monitor your SmartNodes? Do I even have to do this?
- Since you have invested money into SmartNodes you want to make sure they are always running so you receive your Smartcash rewards.
- If something goes wrong you want a history to know when and why it failed so you can fix the issue so it doesn't happen again
- You don't have to do this but think about the above two statements
- Just like backups, no one really like to do backups but when something goes wrong you will be glad you did.
Now on to the guide.
We will walk you through how to monitor your Smartnode/s and how to setup alerts when your node/VPS becomes over burdened.
We will be setting up monitoring for VPS that are installed at Digital Ocean https://www.digitalocean.com/. If you VPS is on a different provider then these step will not apply. Please do your research and look to turning on monitoring.
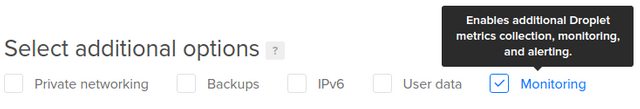
Section 1 Installing
- If you selected Monitoring when you created your droplet then the Droplet Agent is already installed. You can skip to the next section.
- An installation script is available to install the Agent manually. The script will add a repository to your system and use the native package manager to install the Agent. This simplifies package management tasks like upgrading or removing the Agent.
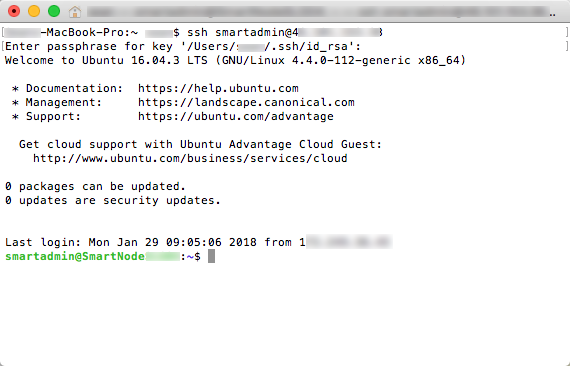
Log into your Droplet asrootor as auserwith sudo access:
If you followed this guide:
https://forum.smartcash.cc/t/secure-your-smartcash-smartnode-vps-on-ubuntu-16-04-with-a-mac-wallet-v1-0/3025
https://steemit.com/smartcash/@controllinghand/secure-your-smartcash-smartnode-vps-on-ubuntu-16-04-with-a-mac-wallet-v1-0
then you should be able to connect to your Smartnode via your Mac terminal - Login
ssh smartadmin@<VPS-IP>
- Once connected, to install and enable the Agent immediately, you can download and execute the installation script by typing:
sudo curl -sSL https://agent.digitalocean.com/install.sh | sh
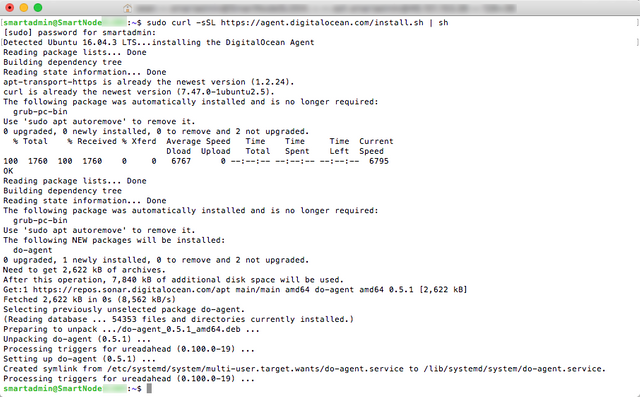
The agent should now be installed and running.


Section 2 How To View Enhanced Graphs
Once the Agent is enabled, visit the Graphs section of your Droplet's detail page:

The extended metrics will be available once your Agent checks in, which may take a moment:

Use the drop-down menu to adjust the time window displayed and mouse over the graphs to view detailed information.
Section 3 How To Set Up Alerts
DigitalOcean Monitoring provides visibility into resource usage across your infrastructure through a variety of metrics. Alert policies allow you to configure customized thresholds for individual resources in order to define healthy usage. Notifications are sent out to let you know when usage exceeds the threshold so that you can respond to changes quickly.
- Create an Alert Policy
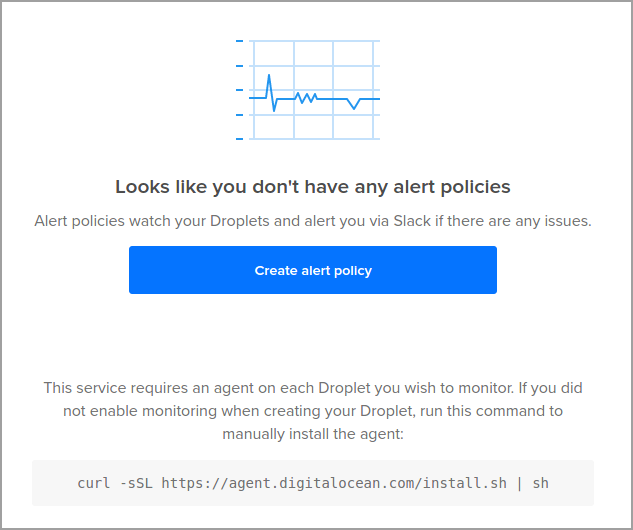
Once the Agent has been installed on your Droplets, you can begin creating alert policies. In the control panel, click Monitoring in the top menu:

- On the page that follows, click on the Create alert policy button. If you don't currently have any alert policies in place, you will see a welcome screen with the button in the center:
- If you have active alert policies, the button will be on the right-hand side:

You will be taken to the alert policy creation page. - Choosing a Metric and Setting a Threshold
Each alert policy is composed of a metric, a threshold, and an alert interval. These can be configured within the Select metric & set threshold section.
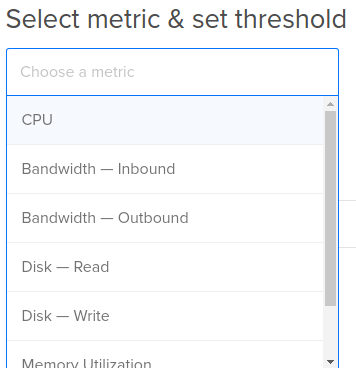
The first step in defining an alerting policy is to choose the resource you wish to create a policy around. The following metrics are supported:
CPU: The percentage of total CPU used on the Droplet, out of 100%
Bandwidth — Inbound: The amount of incoming traffic to the Droplet, in MBps
Bandwidth — Outbound: The amount of outgoing traffic from the Droplet, in MBps
Disk — Read: The read activity for the Droplet's disks, in MB/s
Disk — Read: The write activity for the Droplet's disks, in MB/s
Memory Utilization: The percentage of total memory being used, out of 100%
Disk Utilization: The percentage of the root disk storage being used, out of 100% - Select a metric you'd like to configure an alert policy around. For this guide, we'll select CPU:
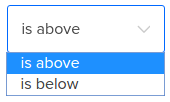
- In the next field, choose whether you want to receive an alert when the resource utilization is above or is below the threshold we will set. In most scenarios, alerting when usage climbs above the threshold is the more helpful option, since high usage tells us that the current resources may no longer be sufficient. For this reason, we will choose is above for our policy:
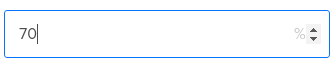
- Next, set the actual threshold value for triggering an alert. This will be a specific value or a percentage, depending on the metric you selected. Since for this example we are creating a CPU alert policy, this will be a percentage.
Note: The threshold value you should choose depends largely on what your intentions are for the alert policy and the amount of usage that is considered normal for that resource in your infrastructure. For example, the normal CPU usage for a computing cluster is likely to be different from that for a web app. Likewise, a threshold designed to give you an early indicator that you may need to scale out might be different from an emergency threshold that should be addressed immediately.
For our example, we'll use 70% for our alert policy, which indicates substantial, but not excessive utilization:
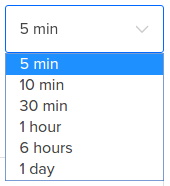
- The next field represents the alert interval. Metrics are averaged over the selected interval to decide whether to trigger an alert. The alert window can range from 5 minutes to 1 day. We will choose 5 min so that we are alerted quickly if the average usage exceeds our threshold:
Now that we've defined the parameters of our alert policy, we can tie our policy to specific Droplets.


Section3 Applying the Policy to Droplets
- The Select Droplets or Tags section includes a field where you apply the alert policy to specific Droplets or groups of Droplets.
In the provided field, you can input the names of individual Droplets, Droplet tags, or a mixture of these two identifiers. Adding Droplets by name allows you to target individual resources unambiguously. Adding tags to an alert policy provides flexibility in deciding which Droplets are covered by the policy by adding or removing tags from Droplets.
Select the Droplet or Droplets that you wish to apply the alert policy to. Remember that only Droplets with the Agent installed will be monitored:
If all your Droplets are SmartNodes then selectAll Droplets

Otherwise

Once the alert policy has been associated with at least one Droplet or tag, we can continue.


Section 4 Selecting the Alert Notification Method
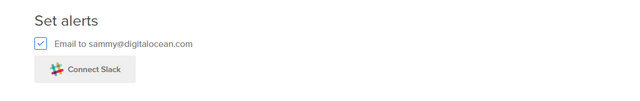
When an alert is triggered, a notification is sent. DigitalOcean can currently send notifications to your DigitalOcean account email address, or using Slack. More than one notification method can be enabled and at least one alert type must be selected.
- By default, the email associated with the current DigitalOcean account is selected.
At this time, you cannot add or change the alert email address for an individual account. - Team Accounts
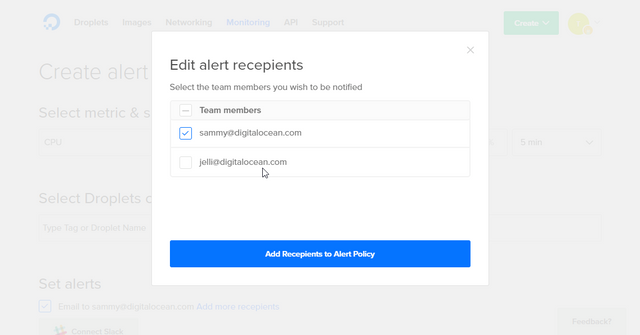
When you create an alert policy from a Team account, you'll have the option to select any of your teammates as email recipients for an alert.

When you click Add more recipients, you'll be given a list of your team's email addresses. Select each address individually or use the checkbox by the Team members header to select or deselect all the addresses on the list.
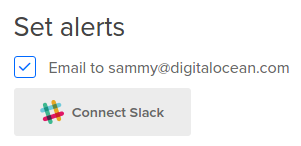
- If you are part of a Slack organization, you can choose to connect your Slack account to receive notifications in Slack. Click the Connect Slack button to authorize DigitalOcean to create notifications within your Slack organization:
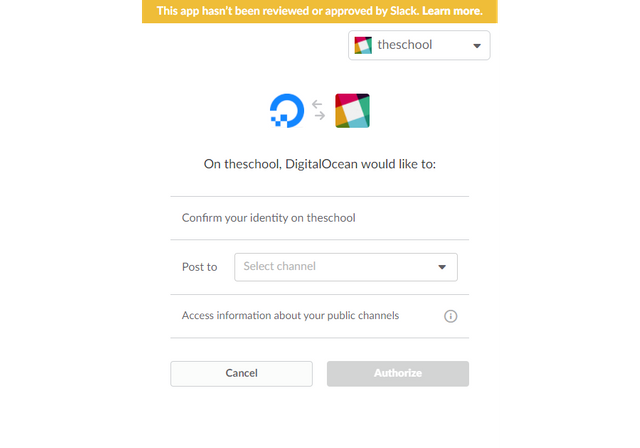
On the authorization page that follows, you can select any Slack teams you are authenticated to or log into a different team. You can then choose to notify Slackbot (which will send messages only to you), notify a channel, or notify any person or group through direct messages.
For this demonstration, we will use the DigitalOcean account email notification, so we do not need to modify any of the settings in this section.


Section 5 Choosing an Alert Name and Saving the Policy
Finally, choose a name for the alert policy. This name will be used to identify this specific alert policy when notifications are sent, so it is important to choose a unique and descriptive value.
- We will call our alert Test CPU Alert:
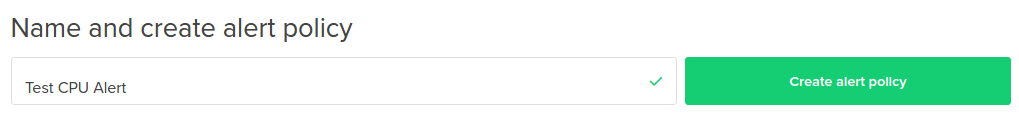
When you are finished, click the Create alert button to create the alert policy.
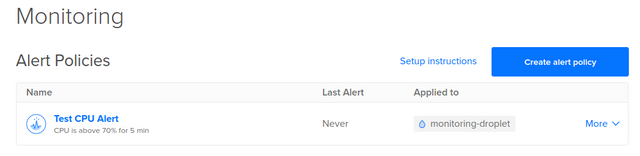
Your alert policy will be created. You will be taken back to the Monitoring index page, where your new alert will be visible:
Now that we have an alert policy, we can trigger it to test our notifications.

Section 6 Trigger an Alert
After creating a new alert policy, it is important to test it. We need to ensure that it triggers correctly and that we are able to receive notifications when an alert is triggered. Log into the Ubuntu 16.04 Droplet covered by your alert policy to continue. It may be best to create and add a new Droplet to your policy for testing if you are concerned about interrupting services on a production host.
- To generate the necessary CPU usage to trigger an alert, we will use a tool called stress, which is available in Ubuntu's default package repositories. Update the apt package index and install the utility by typing:
sudo apt-get update
sudo apt-get install stress
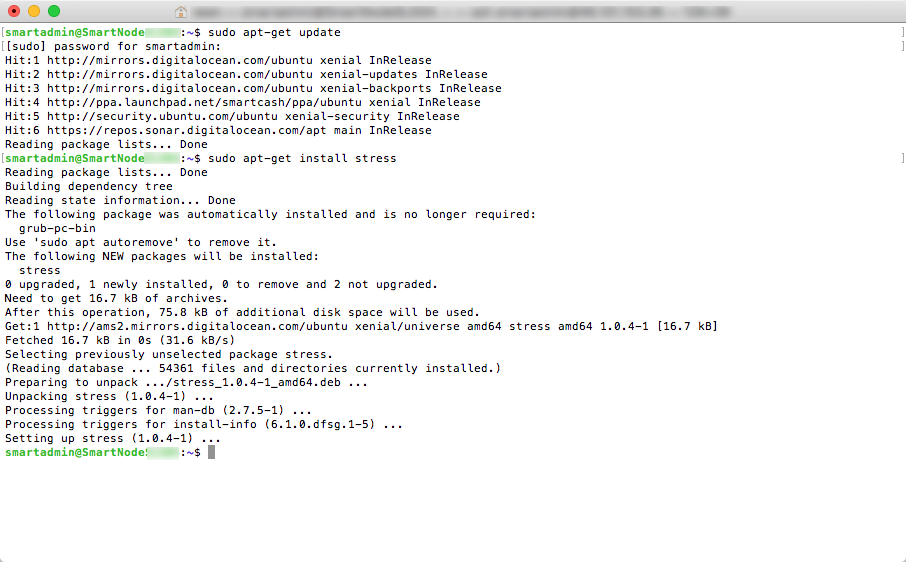
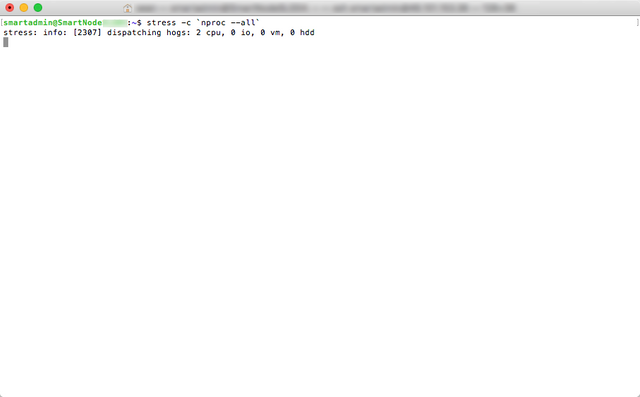
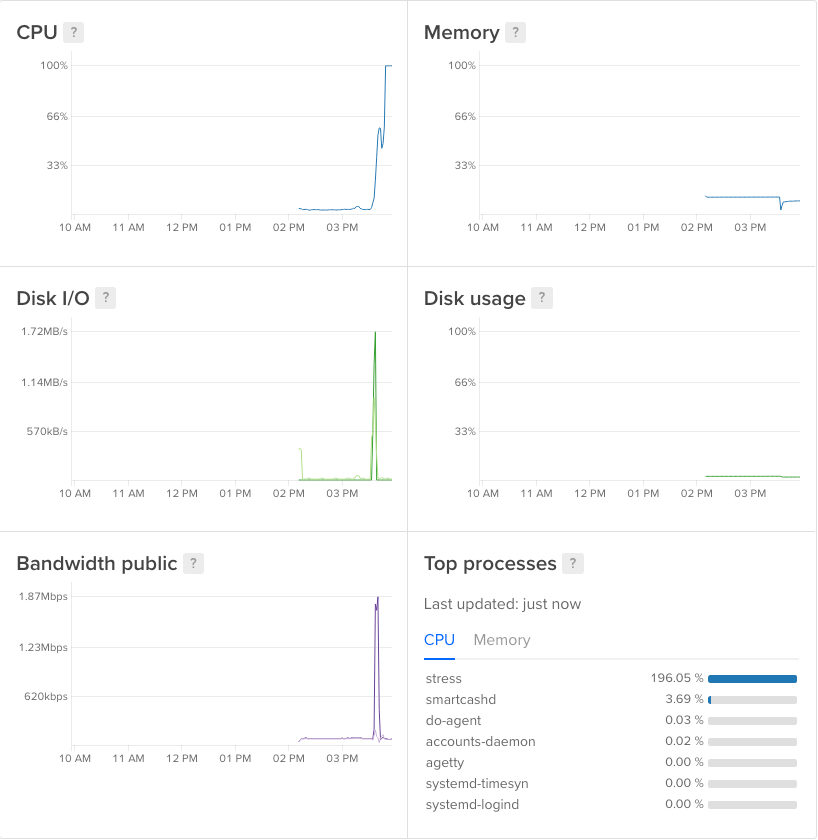
Oncestressis installed, run this command to occupy your Droplet's CPUs:
stress -c `nproc --all`
This will start a worker process for each of your Droplet's processors to generate high CPU usage metrics. Leave the process running so that the usage exceeds the configured threshold for the alert interval we selected.


Section 7 Check for Notifications
Since our alert policy is configured to trigger after the threshold has been broken for five minutes, we should expect to receive our first notification shortly. Keep an eye on the email address associated with your DigitalOcean account.
The notification email will indicate the name of the alert policy in the subject line.
The body of the email shows the value of the metric that triggered the alert as well as the threshold that was broken. A link to the alerting Droplet's page in the control panel and the Droplet's IP address are also provided:

Now that we have successfully triggered the alert, we can stop our CPU-hungry process to test the resolution notification.
Here is an example alert sent via slack

Section 8 Resolve the Alert
Alerts are resolved automatically when the average resource use over the alert interval falls back into the expected range. At this time, alerts cannot be manually resolved or acknowledged.
Let's consider our example. Our CPU alert policy was configured with a threshold of 70% and an alert interval of five minutes. This means that the alert will be resolved when the average of CPU metrics collected during the last five minutes falls below the 70% threshold. This provides a good balance that allows a Droplet to transition out of the triggered state when there is a reasonable expectation that a new alert won't be triggered again immediately afterwards.
To resolve our alert, we need to stop our stress process to allow the CPU usage to drop below the threshold for a while. If you haven't already, on your Ubuntu 16.04 Droplet, press CTRL+C to stop the stress process and return to the bash prompt.
After the average CPU usage over five minutes falls below 70%, the Droplet will transition out of the triggered state and you will be sent a resolution email.
Again, the subject line will mention the alert policy by name. The body of the resolution email reports the total time that the Droplet was in the triggered state, the current average of the metric over the alert interval, and the Droplet's IP address. A link is included to the alert policy in case you would like to make any changes:

The current alert has now been resolved. The alert policy will continue to monitor the Droplet's CPU usage going forward.
Section 9 Suggested Settings
Here are the settings I have for all my Droplets. Feel free to modify to your liking.
Bandwidth Inbound is above 1Mbps for 5 min
Bandwidth Outbound is about 1Mps for 5 min
CPU is above 70% for 5 min
Disk Read is above 1MB/s for 5 min
Disk Write is above 1MB/s for 5 min
Disk Utilization is above 70% for 5 min
Memory Utilization is above 70% for 5 min

Conclusion
The DigitalOcean Agent expands the coverage of Droplet Graphs to provide additional information about your server's performance and resource usage and enables alert policies so that you can receive timely notifications about usage changes. To learn more about the DigitalOcean Monitoring, check out these guides:
For more information visit:
https://www.digitalocean.com/community/tutorials/an-introduction-to-digitalocean-monitoring
https://www.digitalocean.com/community/tutorials/tracking-droplet-performance-with-digitalocean-droplet-graphs
https://www.digitalocean.com/community/tutorials/how-to-set-up-alerts-with-digitalocean-monitoring
https://www.digitalocean.com/community/tutorials/glossary-of-digitalocean-monitoring-terminology-and-metrics
That was so detailed man!!! Great job!!
Thanks! I'm glad you though so :-).
Thanks again, love your work.
Thanks! Do you have a SmartNode? I saw your post about craptopia. I feel for your brother.
https://steemit.com/smartcash/@jasonstaggers/damn-you-cryptopia-free-my-smartcash
Just set up my third SmartNode thanks to your guides. I am the ultimate noob so you've done well if I can follow.
Yeah, that sucked not being able to access my SMARTS, but thankfully they freed them in time for block 300k.
congratz! hopefully the market will recover soon.
In it for the long haul so not too worried. Plus been holding some of my smarts for a while so I'm about even with the market now.
Me too. Time will tell.
@smartbot tip @controllinghand 1
@smartbot tip @simplifylife 1
Σ$$$ Tipped @simplifylife
Σ1 SMART! Comment@smartbot helpto claim. Currently the price of SmartCash in the market is$0.512 USDperSMART. Current value of the tip is$0.51 USD. To find out more about SmartCash, please visit https://smartcash.cc.Σ$$$ Tipped @controllinghand
Σ1 SMART! Comment@smartbot helpto claim. Currently the price of SmartCash in the market is$0.615 USDperSMART. Current value of the tip is$0.61 USD. To find out more about SmartCash, please visit https://smartcash.cc.@smartbot balance
You have
Σ10 SMART(unconfirmed:Σ0 SMART).Great post and a lot off effort from your side. It is very usefull information about monitoring the node. There is also a perposal to vote on to enable a bot to have this info on discord and telegram. Check it out!
Yes @nitego pointed that out to me earlier. I look forward to it passing. I voted in favor of it.
Thank you. Now I will have to take another look at Vultr and see what can do to monitor.
let me know what you find. Perhaps I can take that data and import to the monitoring guide?