What is NDVI and why it is an indication for vegetation cover
NDVI is an abbreviation you might have already come across in some research on aerial photography or remote sensing. It stands for Normalized Difference Vegetation Index and is method of transforming imagery to an excellent indicator for the amount of green vegetation cover and the health of vegetation. This makes it an ideal proxy for examining changes in vegetation for analyzing climate shifts or soil variability for optimizing agricultural outputs.
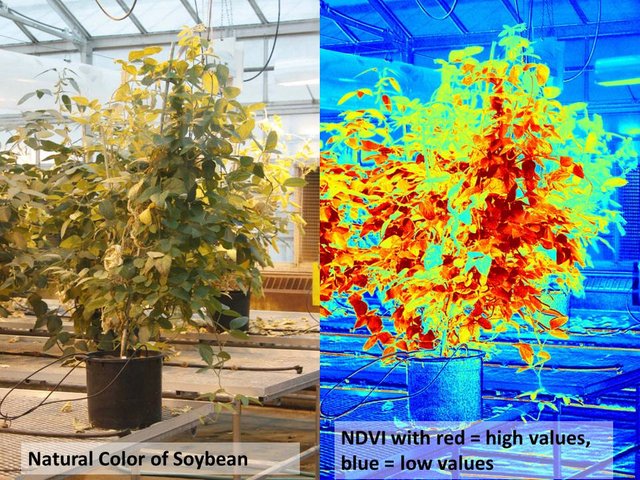
Image source, NDVI as an indicator for vegetation.
Introduction to remote sensing
First of all, sensors in remote sensing (such as in aerial photography or satellite images) can construct pictures by analyzing which wavelengths get absorbed and which wavelengths get reflected for a certain area. This is pretty logical as it means that, for example a blue surface, would reflect a lot of blue light and absorb more of the red and green wavelengths. These reflectances are measured for different wavelengths and can be used to display a map. These sensors can measure all possible wavelengths, but due to our biological limitations it is only possible to visualize these using the three wavelengths we can differentiate, being Red, Green and Blue. If for example a sensor mapped the infra-Red reflectance of a study area, it can only be visualized using one of the three colors.
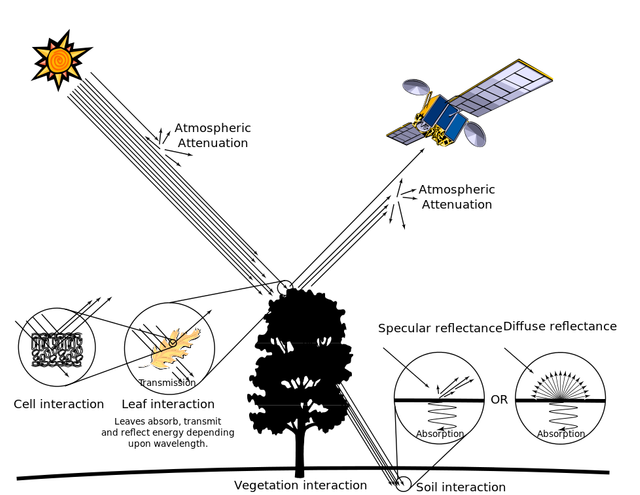
Image source showing the principles of remote sensing.
Remote sensing has thus also the great advantage that it can analyse wavelengths that are not visible to the human eye. As humans would only be able to detect objects based on the visible light spectrum (Red, Green and Blue), Remote sensing allows to differentiate even further based on a broader spectrum of wavelengths. A similar green object could have a variety of different properties that are not visible from regular aerial imagery.
How is the NDVI calculated
For calculating the Normalized Difference Vegetation Index researchers are looking to detect chlorophyll in images, the pigment that gives healthy plants their green color. Luckily chlorophyll has a very specific pattern of absorbing and reflecting light and can be "easily" detected. Chlorophyll is green (reflects green) as most of you know, and thus absorbs a lot of blue and red light (as the presence of this would return a brown color). On top of this, Chlorophyll is known to reflect more infrared light that is invisible to the human eye.
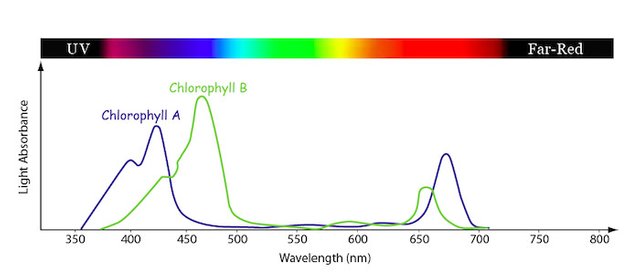
Image source showing the absorbance of blue and red light by Chlorophyll.
So if we could take an image of the earth, and filter out cells that reflect very little of the red wavelengths but reflects a lot of infrared, those cells can confidently be classified as green vegetation as no other land cover has this similar reflection pattern. To normalize the calculation a universal formula has been made to give an index of the difference in vegetation, The NDVI.
NDVI = (NearInfraRed - Red)/(NearInfraRed + Red)
This formula returns a value between -1 and 1. When a lot of red is absorbed and infrared is reflected, the equation value of "Red" comes close to 0 and the NDVI value will approach 1, no matter in what unit the reflectance is measured. When on the other had red is not absorbed but also reflected (less chlorophyll), the amount of reflected red light can come close to the amount of reflected infrared and the NDVI value will approach 0.
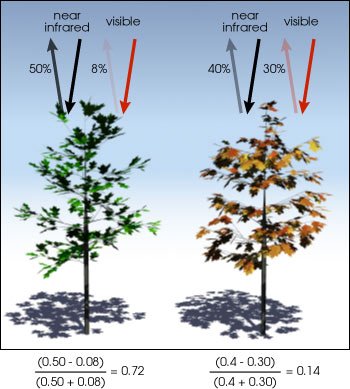
Image source showing how green vegetation with chlorophyll reflects more green light and creates a larger NDVI value.
Practical uses of NDVI
The NDVI was first used to analyze seasonal variations in vegetation cover on a global scale. It was very successful in later on it was more and more used in local studies.
Recently the NDVI has been combined with the new technology in the field of drones to precisely map agricultural fields. This allow micromanaging of crops resulting in an optimal use of pesticides and fertilizer.
Critique on the NDVI
The NDVI is a very useful proxy for analyzing the presence of green vegetation and the word green is really the key word. When we look at desertification for example (a topic I am studying a lot now), A rise in NDVI does not indicate a return of vegetation in desertified areas. As herbaceous plants can react fast on slight changes in precipitation, a slight increase in rain can result in a "NDVI-boom", but this vegetation can die just as fast as it came. The real indicators for desertification are woody plants and trees, but these do not show in NDVI maps as they carry no chlorophyll.
Further more does NDVI not indicate biodiversity, another crucial factor for assessing biomes. An increase in NDVI might look desired, but it can also indicate a colonization of an exotic species overgrowing native vegetation.
Conclusion
The NDVI is a breakthrough in remote sensing an analyzing data, but should be used with caution. It is important to know exactly what you measure before drawing any conclusions. This is not only true for the NDVI but for many proxies used in research.
Sources
All images in this article were licensed for reuse.
http://gisgeography.com/ndvi-normalized-difference-vegetation-index/
https://www.botlink.com/blog/discover-ndvi-and-its-valuable-uses-in-agriculture
https://earthobservatory.nasa.gov/Features/MeasuringVegetation/
Ndvi: Vegetation Change Detection Using Remote Sensing and Gis – A Case Study of Vellore District
Being A SteemStem Member
wow it's amazing, i just found out about the science you post...@samve
continue my brother your work is very inspiring
Informative post.thank you very much.
Excelent topic. It is a science. Can this method also do subsoil studies?
As light does not penetrate into the subsoil it will not be able to get any information from there. But I have read about techniques to detect permafrost in soils. Pretty impressive I believe!