Quantitative PCR: A Brief Introduction
PCR is a breakthrough technology that has become almost universal in biotechnology and DNA analysis. Here I will discuss some basic concepts about quantifying DNA using Real-Time PCR, abbreviated here as qRT-PCR.
It is assumed that the reader already has a basic understanding of PCR, knows what the Polymerase Chain Reaction (PCR) is and how it is used, so this post is not a basic primer in PCR.
I will refer to qRT-PCR in many future posts, so I hope we will find it helpful to first discuss some basic concepts relevant to performing PCR reactions quantitatively. The ultimate objective is to determine the presence and concentration of a specific and defined DNA sequence within a mixture of many DNA sequences.
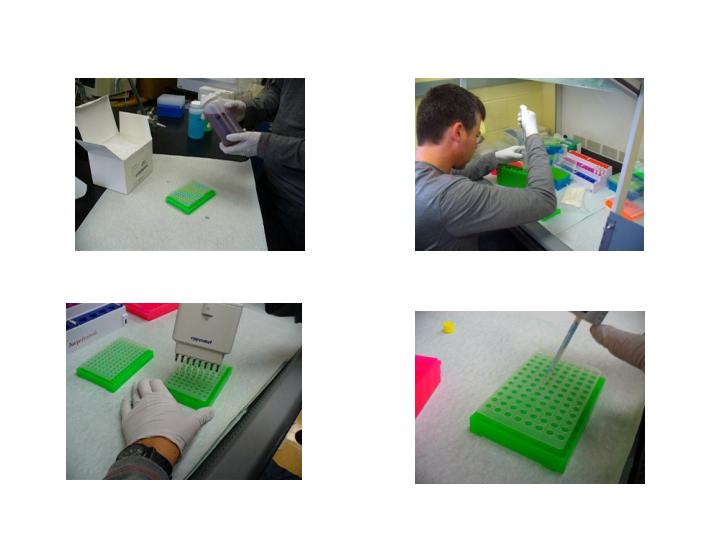
Setup of PCR reactions using standard procedures
The only difference compared to standard PCR is that a fluorescent dye is incorporated into the system. It may be an intercalating dye or a fluorescent-labeled oligonucleotide.

Video of 96-well plate being covered by optical film:
https://app.box.com/s/rfeb7gndys5p3n45gclooxlojf4iyjra
(Photo and video credit: @qiyi)
Quantitative PCR
We will discuss why the amount of amplified DNA seen in an aliquot of the final product is not necessarily related to the amount of template DNA in the original sample. However the kinetics of the reaction are mathematically related to the starting quantity, or SQ, of template DNA initially added to the PCR reaction.
Instruments
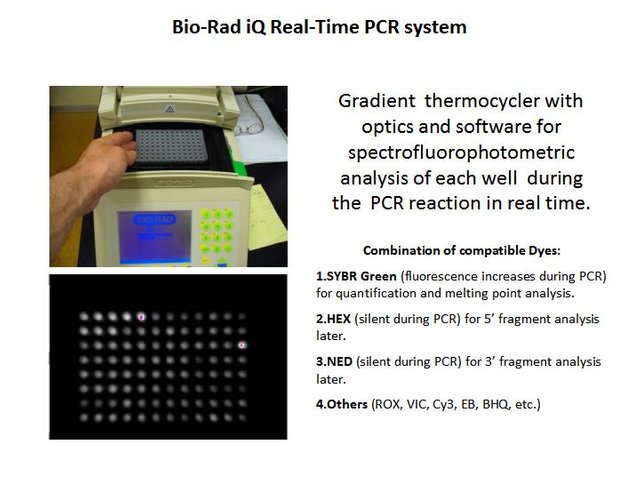
So how do we monitor PCR reaction kinetics? Fluorescence. An instrument is required to measure fluorescence inside each individual PCR reaction, usually one of many simultaneous reactions on a 96-well plate. If the plate is covered with optically clear film, we can watch the PCR reactions from above. The results appear on the computer screen after each cycle, so that's how the term "real-time" was added.
I used a Bio-Rad iCycler capable of monitoring at least four fluorescent dyes simultaneously.

(Photo credit: @qiyi)
The instrument also has a gradient thermocycler and capability for melting point analysis. I learned to use these features for method development and PCR troubleshooting.
Correlation between PCR reaction and fluorescence
Several methods to correlate fluorescence with PCR amplification have been developed, such as intercalating dyes (ID), TaqMan probes, and molecular beacons.
Whichever technique is used, the accumulation of double-stranded copies of the desired amplified segment is accompanied by an increase in fluorescence.
Fluorescence Detection
The simplest and most versatile technique described by Ponchel et al., 2003 is to include an intercalating dye such as SYBR Green by Molecular Probes (now ThermoFisher). SYBR Green is 200x more fluorescent in the presence of double stranded DNA than single stranded DNA. As double-stranded PCR products are built from the single stranded primers, nucleotides, and a trace of DNA template in the presence of a vast excess of SYBR Green, SYBR Green fluorescence increases in proportion to PCR amplification.
Below is a gif file illustrating how PCR in the presence of an intercalating fluorescent dye can cause an increase in fluorescence as double-stranded PCR products are produced, theoretically doubling each cycle:
(gif credit: @qiyi, created by modification of a Bio-Rad PowerPoint presentation for instrument training)
Concentration from fluorescence data
We thus observe a mathematical relationship much like the inverse of radioactive decay and half life. Instead, we have amplification and duplication during each cycle.

(Photo credit: @qiyi)
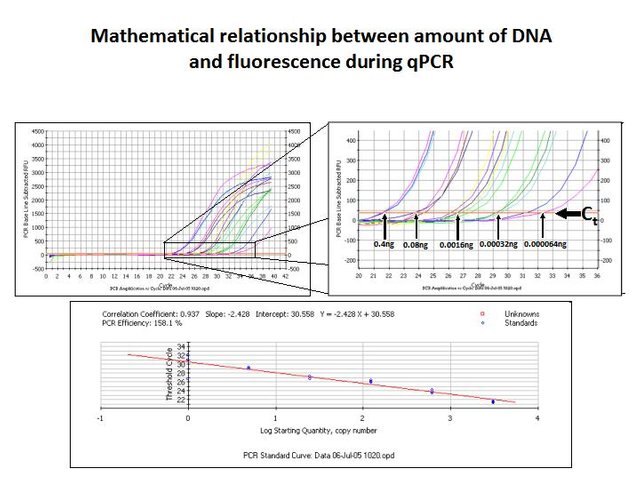
As can be seen in the diagram above, the starting quantity, SQ, of template DNA added to the PCR reaction does have a concentration-dependent effect: The natural log of SQ is inversely proportional to the number of cycles required to reach a fluorescence threshold, called the threshold cycle or Ct.
The basic concept is that it takes fewer duplication cycles to produce a significant yield of a ds-PCR product when you start with a higher concentration of template in the first place.
By constructing a standard curve with independently verified DNA template concentrations, one can measure the Ct of an unknown sample and determine the SQ of template DNA in the aliquot added to the reaction.
We now have determined the amount of a particular DNA sequence in a given volume of water. For example, our standard curve says it takes 24 cycles to reach a threshold SYBR Green fluorescence when 0.08 ng of template are used. We know that 5 microliter of DNA sample were added to the reaction, so:
(0.08 E-09)g/(5 E-06)L =
1.6 E-05 g/L or 16 ng/ml or 16 picograms/microliter of template in the original DNA solution.
The value represents the concentration of the DNA template sequence, not the total DNA concentration. This allows one to monitor a specific DNA sequence even if part of a complex mixture of sequences, including closely homologous sequences and SNPs.
Expressing results
Many means of expressing DNA concentration are appropriate for different applications. Micrograms or ng per ml or microliter are commonly used, as is copy number.
Copy number is equivalent to moles therefore it is useful in expressing the number of copies, or molecules of template in the original DNA sample. In order to express results as copy number, a plasmid with the template sequence spliced in must be used as a quantification standard. A plasmid has a known sequence and known molecular weight, therefore the molarity can be calculated from mg/ml or ppm, for example.
I have used parts per million, ppb, ppt, even parts per quadrillion! And since the kinetics are logarithmic, accurate results can be measured over four or five orders of magnitude. I have demonstrated detection of as little as a hundred molecules, and quantification of as little as a few thousand molecules.

(Photo credit: @qiyi)
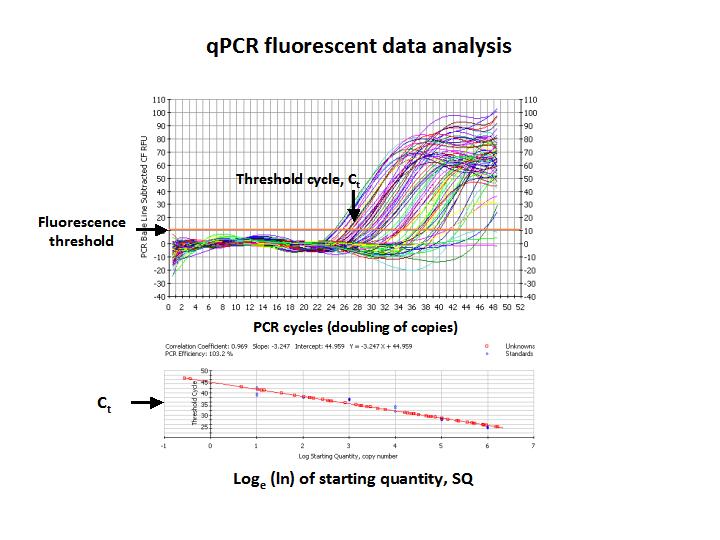
The upper graph above shows the fluorescent trace as a function of the number of PCR cycles, and each colored line on the graph is a measure of fluorescence from each well in a 96 well plate. The red points on the lower graph are DNA samples of unknown concentrations which can be determined by correlation of Ct measured for each unknown to the SQ of template from the standard curve.
The amount of PCR product present in the final reaction mix does not necessarily reflect the amount of DNA template originally added to the PCR reaction. The final amount of product is limited by the availability of primers and free nucleotides, and the PCR reactions plateau at that point. Due to the exonuclease activity of Taq Polymerase, final PCR products are gradually degraded after depletion of primers and nucleotides.
Examine the last figure. Ironically, the first PCR reaction to reach Ct has degraded so that the final amplified product is actually less than others with less SQ and a later Ct. this is why intensity or presence of a band on an agarose gel does not reflect the SQ of template originally added to the reaction.
qRT-PCR in the presence of intercalating dyes for PCR troubleshooting
Special problems arise when too much template is present that prohibit the possibility of a chain reaction, leading to a characteristic fluorescent trace. Another issue is inhibition of PCR by some factor, and this also produces a characteristic trace.
qRT-PCR in the presence of SYBR Green can be used to troubleshoot PCR reactions much more effectively than gel electrophoresis. This topic will be discussed in detail in future posts.
Reference PDF:
Real-time PCR based on SYBR-Green I fluorescence: An alternative to the TaqMan assay for a relative quantification of gene rearrangements, gene amplifications and micro gene deletions, Frederique Ponchel*, Carmel Toomes, Kieran Bransfield, Fong T Leong, Susan H Douglas, Sarah L Field, Sandra M Bell, Valerie Combaret, Alain Puisieux, Alan J Mighell, Philip A Robinson, Chris F Inglehearn, John D Isaacs and Alex F Markham (2003).
BMC Biotechnology 2003, 3:18
https://bmcbiotechnol.biomedcentral.com/track/pdf/10.1186/1472-6750-3-18
Wikipedia article on real-time PCR:
https://en.m.wikipedia.org/wiki/Real-time_polymerase_chain_reaction?wprov=sfti1
Wikipedia article on PCR:
https://en.wikipedia.org/wiki/Polymerase_chain_reaction?wprov=sfti1
Publication example of assay development and application by the author:
https://ojs.zrc-sazu.si/carsologica/article/viewFile/21/18

Being A SteemStem Member
Resteemed your article. This article was resteemed because you are part of the New Steemians project. You can learn more about it here: https://steemit.com/introduceyourself/@gaman/new-steemians-project-launch
Just by curiosity, are you one of the authors of the article quoted as a reference?
No, I am not. However I used the technique and developed it as a real art. We found ways to use it never anticipated, especially the melting point feature. I plan to post a single article to explain melting point analysis for reference in later posts.
Excellent for the future post! I am looking forward to read it!
Please consider joining us on steemstem, a discord server where most STEM lovers of the platform are :)
A
B
Thanks. This link may work as well...
Great article! Well done!
Have you used betaine as an amplification enhancer? Here are a few references on this use of betaine (by no means a comprehensive list):
There is a connection though: Betaine is especially important now because it is useful for improving results with repetitive sequences, now used for DNA fingerprinting and much more. The first years of my career (1979-1986) I did early work on repetitive sequences, called satellite DNA at the time. Unfortunately that pre-dated PCR and it was not a tool we had, but in retrospect I think of all we could've done if we had PCR! We had to isolate a 3% fraction of DNA extracted by dissection of specific organs from crabs. We could not isolate enough DNA from a single animal for analytical methods available at the time, so we had to pool tissue from several animals for further analysis. With PCR we could have amplified the sequences of interest from a few mg of tissue.
No I never used betaine.