Quantification and Characterization of a Bacterial Community in Sediments from Mammoth Cave
Molecular surveys of bacteria in Mammoth Cave National Park were carried out from 2001-2006. Our ultimate goal was to characterize cave microbial communities and monitor the cave for any problems such as fecal or chemical contamination in the world’s most extensive karst groundwater system. Mammoth Cave is a World Heritage Site and International Biosphere Reserve.
A major objective was to quantify and characterize the native cave bacteria beyond what had previoulsly been known by culturing bacteria on plates (Rusterholtz and Mallory, 1994, Elliott et al., 2000). Another goal was to determine the abundance of bacteria in the nutrient-deprived and dark cave conditions. Point sources of pollution are responsible for incidents that threaten the protected cave environment and indigenous organisms.
In this study the techniques for DNA extraction and Quantitative Real-Time PCR were compared in triplicate and in eight separate samples taken from a key study site. This established the reproducibility of the technique, and the PCR products obtained after quantification and amplification were cloned and sequenced.


Figure 1. Charon's Cascade (photo by Chief Ecologist Rick Olson; map modified by @qiyi from Palmer et al., 1981)
Sediment samples were collected from eight points around the perimeter of a permanent pool at the base of the waterfall at Charon’s Cascade (Figure 1). Clastic sediments at Charon’s Cascade are representative of the homogeneous fine sand derived from the regional sandstone caprock distributed by underground aquifers throughout the cave system, thus affording a convenient substrate for site-to-site comparisons.
In our initial survey of DNA in different types of cave samples showed that these sandy deposits contained the highest concentration of bacterial DNA compared to other sample types as detailed in a previous post.
Methods
DNA Extractions and Quantitative Real Time PCR
Triplicate DNA extractions using 10 g from each of the eight cave sediment samples were carried out using 10 g soil DNA extraction kits (MOBio Laboratories, Carlsbad, CA) and the environmental nucleic acids were visualized by agarose gel electrophoresis. Bacterial 16S rDNA was selectively amplified from the environmental DNA mixtures with universal eubacterial primers 27f and 1492r in the presence of SYBR Green® I (Ponchel et al., 2003). Quantification standards consisted of a set of reactions containing E. coli genomic DNA standards of accurately known concentration to generate a standard curve for quantification, with all reactions carried out in triplicate (Figure 2, Figure 3, Figure 4). Concentrations were determined by UV spectrophotometry and fluorometry with the Qubit System by Thermo-Fisher. Complete experimental details can be found in a previous post.
Cloning and Sequencing of 16S rDNA
The amplified 16S rDNA from one of the samples was ligated into the cloning and sequencing vector pGEM-7zf(+) for DNA sequencing of individual copies of the cave bacterial 16S rRNA genes. A cave clone library was constructed by transformation of E. coli followed by purification of plasmid DNA from each clone (Sambrook et al., 1989). Sequences were determined in duplicate with multiple overlapping fragments generated by the T7 and SP6 primers in the vector, and the universal 16S rDNA primers 530f and 1100r (Lane et al., 1991) on an ABI 3100 Sequencer (Applied Biosystems). Sequences were deposited on GenBank with accession numbers GQ500694-GQ500738.
Classification of Cave Eubacterial 16S rDNA
Nucleotide sequences of bacterial 16S rDNA from the library were determined and compared to DNA sequence databases to find the taxonomic classification of the nearest cultured isolate with >1200 bp of sequence data using Genbank. Tools provided by the Ribosomal Database Project (RDP) were used to produce a phylogenetic tree (Figure 5).
Sequences were aligned and stored with tools available from the RDP, and aligned sequences were downloaded from the RDP as Phylip-compatible files. The Phylip software package was used to calculate distance matrix, nearest neighbor values, and bootstrap values (1000 repetitions) among 46 cave clones and 41 of their most closely aligned neighbors, using the Kimura 2-parameter method and empirical base frequencies. The tree was constructed using the neighbor joining method with an Aquifaceae defined as the outgroup with randomized input order of species.
Results
Quantification of Bacterial Genomic DNA in Cave Sediments
Triplicate procedures on eight different samples established the efficiency, variability, and accuracy of the method for quantification of eubacterial genomic DNA in cave sediments (Figure 2). One of the samples had a higher concentration than the others, but overall the results were very consistent. Variability among nine samples for each sediment sample ranged from 1-5% (triplicate qRT-PCR on triplicate DNA extractions). The average bacterial DNA concentration was 1297 ng/g in sediments collected beneath the pool.
The method was also used with membrane filters to express bacterial load in water samples over the range of 2-20,000 ng/L (parts per trillion).

Figure 2. Graph of qRT-PCR data against a standard curve generated with E. coli genomic DNA. (Source: @qiyi)
The values expressed are relative to E. coli genomic DNA as a quantification standard. E. coli has about seven copies of 16S rDNA per genome, which is in the average range. Thus, the quantity of DNA expressed is equivalent to genomic DNA as exemplified by E. coli.
Note that two bar graphs are shown with the normalized results. One graph has a linear y-axis (Figure 3) for illustration in this post.
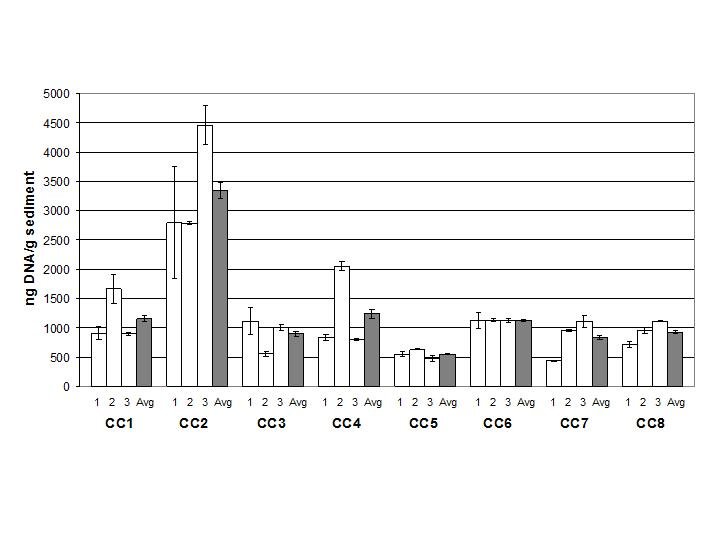
Figure 3. Normalized eubacterial genomic DNA concentration in Charon’s Cascade sediments (linear y-axis). (Source: @qiyi)
However, other cave sites studied had orders of magnitude less DNA than Charon’s Cascade. Therefore, a logarithmic y-axis (Figure 4) was used in later studies with artificial substrates because the range of DNA concentrations was so wide.

Figure 4. Normalized eubacterial genomic DNA concentration in Charon’s Cascade sediments (logarithmic y-axis). (Source: @qiyi)
 (Source: @qiyi)
DNA Sequences
Results of DNA sequencing and phylogenetic analysis are shown in Figure 5.

(Source: @qiyi)
Figure 5. Phylogenetic tree of sequence data.
This community was sampled in 2005 before a spike in E. coli was observed in October 2006 at Charon’s Cascade. The National Park Service press release can be read here.
Related Posts
Quantitative Real-Time PCR:
https://steemit.com/science/@qiyi/quantitative-pcr-a-brief-introduction
Mammoth Cave Research:
https://steemit.com/science/@qiyi/a-day-in-the-life-of-a-cave-environmental-biotechnologist
https://steemit.com/science/@qiyi/quantitative-real-time-pcr-assays-of-bacterial-dna-in-biomarkers-for-nitrospira-sediments-of-the-flint-mammoth-cave-system
References
Elliott, L., Wright, S., Coakley, T., & Groves, C., 2000, Microbial ecology of conduit stream interstital fluids of the southcentral Kentucky karst aquifer: Impacts on aquifer development: Proceedings of Mammoth Cave National Park's Eighth Science Conference, p. 57-60.
Lane, D.J., 1991, 16S/23S rRNA Sequencing: in E. Stackenbrandt and M. Goodfellow (eds), Nucleic acid techniques in bacterial systematics, John Wiley and Sons, Inc. New York, NY, p. 115-148.
Palmer, A.N., 1981, A geological guide to Mammoth Cave National Park: Teaneck, N.J., Zephyrus Press, 210 pp.
Ponchel. F., Toomes, C., Bransfield, K., Leong, F.T., Douglas, S.H., Field, S.L., Bell, S.M., Combaret, V., Puisieux, A., Mighell, A.J., Robinson, P.A., Ingelehearn, C.F., Isaacs, J.D., & Markham, A.F., 2003, Real-Time PCR based on SYBR-Green I Fluorscence: An alternative to the TaqMan assay for a relative quantification of gene rearrangements, gene amplifications, and micro gene deletions, BMC Biotechnology, v. 3, no. 18.
Rusterholtz, K.J. & Mallory, L.M., 1994 Density, activity, and diversity of bacteria indigenous to a karstic aquifer: Microbial Ecology, v. 28, p. 79-99.
Sambrook, J., Fritsch, E.F., & Maniatis, T., 1989, Molecular cloning, a laboratory manual (2nd edition): Cold Spring Harbor Laboratory Press, v. 1, p. 1.53-1.86.
very interesting, I made a GIP once about bacteria
ok very nice.
This is extremely well done. Thanks for being here in Steemit. Your works need exposure good sir. Its educational well wrtitten and with the intention to share your knowledge. These posts are more deserving than pictures of food that some other steemians post.
Consider using postpromotion so your work gets more exposure and people with the same interests like me can see more of your work.
Just my 2 cents.
What specific post promotion would you recommend?
Try minnowbooster , they have a moving profit calculator. They try to at least give you a 120% profitability ( although steem price increase or decrease is a factor. )
For example you send $1 SBD , minnowbooster should upvote you at least 120% worth of that in SBD and STEEM rewards.
Have a look at my profile as an example. I've mainly used them compared to other competitors due to the profitability.
Thank you for your kind words and support!
Another great article! Well done!
One of the thing I like most in working with microbes is going to the collection sites.😄
Mammoth cave is really awesome.
By far the longest cave system in the world. Last year it surpassed 400 miles!
I found a link to a better view of the phylogenetic tree, made from samples taken in 2005:
https://app.box.com/s/snkwk4ie4slzrizkq5qelr4lswf0phlo
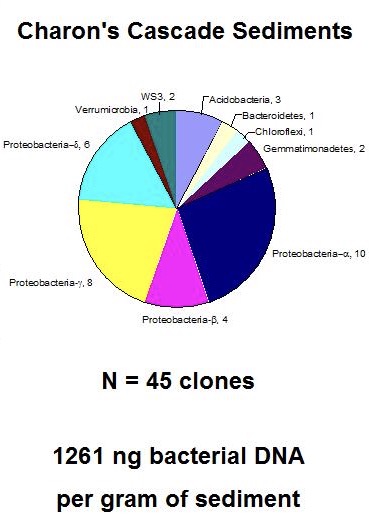
And here's a pie chart summarizing the data for samples taken in 2005:
I looked again at an earlier study by Fliermans & Schmidt (1977) that demonstrates the presence of chemolithotrophic nitrifying bacteria (Nitrobacter sp.) using species-specific fluorescent antibodies to show Nitrobacter cells attached to sediment particles associated with saltpeter mining:
http://scholarcommons.usf.edu/cgi/viewcontent.cgi?article=1493&context=ijs