Determination of the Bismuth-Tin (Bi-Sn) phase diagram by differential scanning calorimetry
Bio
Phase diagram, Phase transitions, Eutectic, Differential scanning calorimetry.
Abstract
A thermal analysis experiment was conducted using differential scanning calorimetry (DSC) to determine the equilibrium phase diagram for the eutectic Bi-Sn system. DSC measures the energy (mW/mg) required to maintain thermal equilibrium between a sample and reference. Seven 20mg samples of varying compositions were analysed at a heating rate of 1°C/min from 0°C-300°C. The output thermograms were used to compile the Bi-Sn phase diagram which saw the eutectic point occur at a composition of 60at% Sn and a temperature of 139°C. The maximum solid solubility limits were found to be 3at% Sn in Bi and 6.5at% Bi in Sn. Undercooling was assumed to be responsible for the discrepancies between the heating and cooling results. Eutectic transformations and lamellar growth were discussed, in addition to the relationship between nonequilibrium cooling, atomic diffusion and coring.
Introduction
There are many thermal analysis methods, all of which subject materials to heat in order to determine their properties. Materials such as metals, ceramics, polymers, drugs and foods can be thermally analysed [1]. Certain characteristics of these materials will undergo changes when the system is heated or cooled, allowing the information to be graphed as a phase diagram. Phase diagrams display melting points and regions where various materials will be solid, liquid or gaseous under certain conditions, such as temperature or pressure [2]. Binary systems such as the Bi-Sn system investigated in this report also factor in the compositional percentage of each component material.
Below are four methods of many, typically used in thermal analysis [2]:
- Dilatometer
- Differential Thermal Analysis (DTA)
- Thermo-gravimetric Analysis (TGA)
- Differential Scanning Calorimetry (DSC)
All four methods operate by creating a thermal balance between a sample and reference crucible/pan (Figure 1). The material to be analysed is placed in the sample crucible while the reference crucible is typically empty [3]. An inert gas is used to sweep through the system to prevent any reactions such as oxidation from interfering with the results [4].
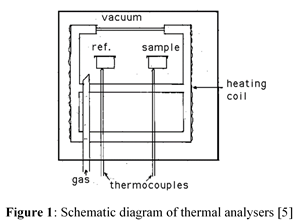
When heat is added to the system, materials undergo various transformations, such as: structural, dimensional and phase changes, chemical reactions and combustion [2]. All of which are the result of the sample and reference absorbing and evolving heat energy. A dilatometer detects changes in the sample’s volume by monitoring any expansion or contraction [2]; DTA measures the change in temperature between the two crucibles i.e. endothermic and exothermic events [5]; TGA detects any changes in the sample’s mass relative to the reference’s, due to events such as chemical reactions and combustion [2]; DSC measures the power required to keep the sample and reference crucibles in thermal equilibrium, this is also represented as endothermic and exothermic events on a graph [2]. Performing integration on thermal events seen on a DSC curve will yield the enthalpy for that specific event [3].
Experimental
The laboratory experiment utilised the DSC method for the eutectic Bi-Sn system. The aim was to use the thermograms produced to create a binary phase diagram. To acquire sufficient data to plot a phase diagram, the analysis had to be performed several times for various compositions of Bi and Sn. Each of these analyses were performed over the course of a 6-hour period. A single demonstration of the procedures involved was witnessed, however the analysis was set to run for a 40-minute period since the procedures were the same. Accuracy is the only difference between the actual experiments and the demonstration.
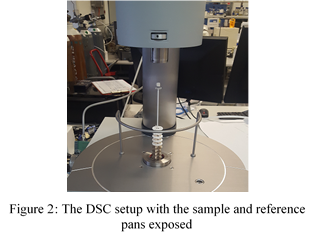
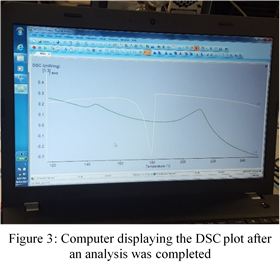
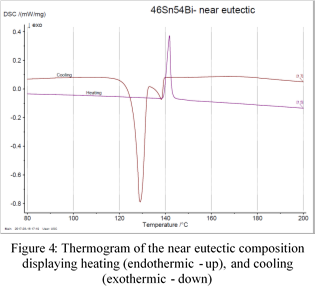
The DSC was prepared for the analysis by sliding up the external sleeve to reveal the sample and reference pans (Figure 2). A 20mg sample of Bi-Sn was placed in the sample pan while the reference was left empty. Prior to commencing the analysis, the temperature range and heating rate had to be configured. The temperature range selected for the experiments was 0°C-300°C, while the selected heating rate was 1°C/min. It was noted that the inert gas that was swept through the system was Argon. The output data was transmitted to a computer where it was displayed graphically (Figure 3). The y-axis represents the energy required by the endo and exothermic events, having units of mW/mg. The x-axis displays the temperature in °C as it changed with time. The exothermic events peak in the -y direction while endothermic peaks are in the +y direction.
Once the sample had reached 300°C, cooling commenced without the use of refrigerants. This allowed for equilibrium cooling to occur, ensuring more accurate results. The graphs acquired at the end of the analysis contained the necessary information required to plot the melting, liquidus and eutectic points on a binary phase diagram.
Results and Discussion
Prior to plotting the phase diagram the results of the experiment had to be interpreted. Seven DSC graphs were obtained from the experiment with the following compositions:
- 100% Bi
- 10% Sn – 90% Bi
- 30% Sn – 70% Bi
- 46% Sn – 54% Bi (Figure 4)
- 60% Sn – 40% Bi
- 80% Sn – 20% Bi
- 100% Sn
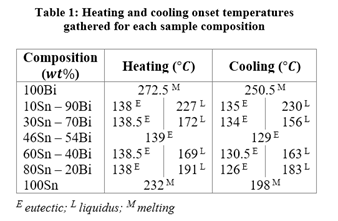
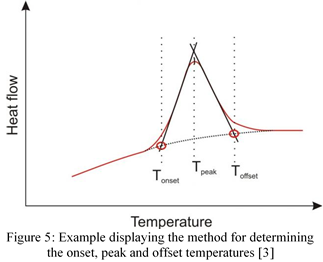
The melting, liquidus, and eutectic points were determined by the temperature at the onset of peaks. The onset is created by extrapolating the baseline and ruling a tangent on the peaks (Figure 5). The point where the tangents and baseline overlap is the value used for that particular event [3]. Finding the onset temperatures from all graphs yields the results seen in Table 1 below.
Prior to plotting the phase diagram, the atomic percent of each composition was calculated. This allowed for the final product to be compared to that of published diagrams. Additionally, it was noted that the eutectic composition from the experiment was stated to be 46% Sn – 54% Bi while published diagrams display the eutectic point as 61at% Sn (Appendix 1). Therefore, it was concluded that the compositions from the experiment were measured as a weight percent. The atomic percent is calculated by:
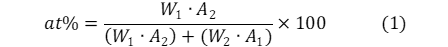
where:
W is the weight percent (wt%)
A is the atomic weight (amu)
The phase diagram seen in Figure 6 was created with the results from Table 1. The results from the heating curves have been graphed with a solid red line, and the cooling with the dashed blue line. The markers displayed in various colour represent the following:
- Liquidus melting (red)
- Liquidus cooling (green)
- Eutectic heating (yellow)
- Eutectic cooling (blue)
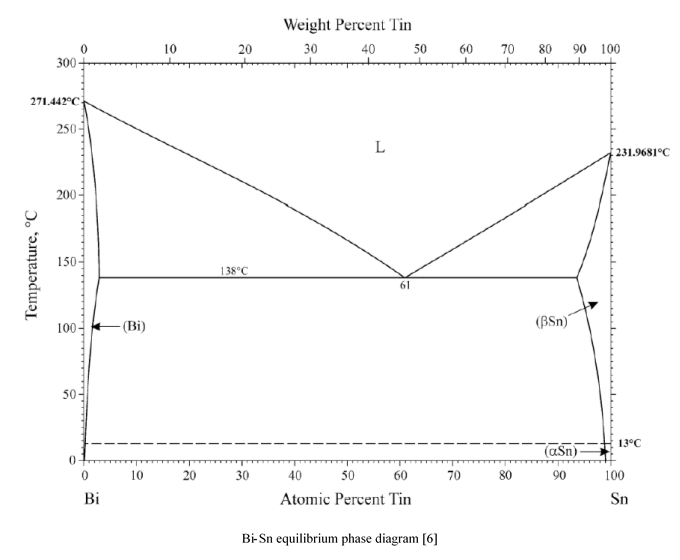
The size of the alpha (α) and beta (β) phases are somewhat smaller on published diagrams (Appendix 1). This is due to the step size of the samples; including additional samples of 5% Sn and 95% Sn would ensure more accurate solvus lines. The α region is a solid solution composed primarily of Bi with Sn as the solute while the β region is primarily Sn with Bi as the solute. According to the published phase diagram for this system (Appendix 1), the maximum solid solubility limits are seen to be 3at% Sn in Bi and 6.5at% Bi in Sn. This maximum solid solubility occurs at 138°C where the α and β phases meet the eutectic line.
The eutectic point on the experimental phase diagram (Figure 6) is shown to occur at 60at% Sn. This value was calculated from Eq. 1 in the following manner:
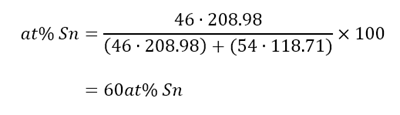
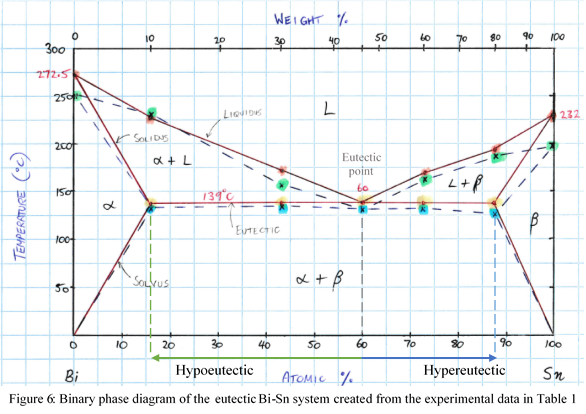
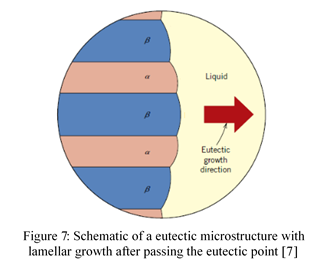
The accuracy of the experiment can be confirmed as the published phase diagram shows the eutectic point for this system to occur at 61at% Sn (Appendix 1). At this composition, cooling the sample through the eutectic point results with the liquid phase going into the two solid phases, α and β [7][8]. This is known as the eutectic transformation, and can be expressed as L⟺α+β. The two directional arrows signify that the opposite transformation will occur if the sample is again heated [7]. Eutectic microstructures form into a lamellar configuration of α and β which grow alongside one another until the liquid region has solidified [7][9] (Figure 7).
The discrepancies between the heating and cooling phases are assumed to be due to undercooling. Undercooling occurs if the cooling rate is too quick; the material will fall below an equilibrium line without undergoing the phase transformation [7]. This can be seen on the cooling curve on the experimental phase diagram at both melting points being 20°C-30°C lower than expected (Figure 6). In order to prevent this phenomenon from occurring, the sample must experience an equilibrium cooling, however, the transition speed required for this is generally quite lengthy, thus is seldom achieved [7]. In this case, the sample will cool into a metastable state, which is technically unstable, however can be long lasting [7]. The same principles apply for superheating, occurring when a sample is heated quite fast, its phase transition may occur above the expected temperature [7].
For a system to cool into an equilibrium state, sufficient time must be allowed for diffusion to occur [7]. The time required for atoms to diffuse is reliant on the temperature; as heat is added to the system, time is reduced exponentially [7][8]. Nonequilibrium cooling results in the system unable to diffuse atoms evenly, consequently leading to coring [8]. If the Bi-Sn system (Figure 6) was rapidly cooled through the α+L region, crystallisation would occur in a nonuniform fashion. This cored microstructure in Figure 8 can be seen having various composition of α; the innermost layer contains the highest percentage which began solidifying at the liquidus line [7][8]. To demonstrate a composition calculation, an arbitrary point on the Bi-Sn phase diagram in the α+L region has been selected (Figure 9).
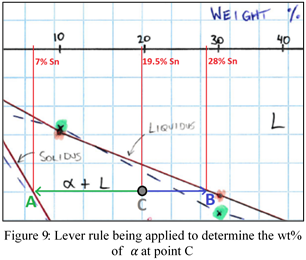
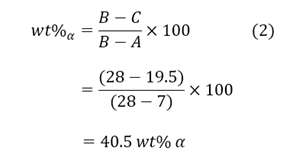
Point C can be seen to have a composition of 19.5wt% Sn and would have begun forming dendrites at the liquidus line. The amount of α present at each temperature can be calculated by use of the lever rule:
As the system cools, more layers are formed and the composition of α continues to decline in each [7][8]. If the material is again subjected to high temperatures, the outermost layers will melt prior to reaching the eutectic temperature [7][8]. The mechanical properties of the material will no longer be reliable since thin pockets of liquid metal will begin to form within the microstructure [7]. To remove coring from the material, homogenisation annealing is utilised [7]. The cored material must be heated to a degree that lies under the eutectic line; allowing diffusion to return the microstructure to equilibrium [7].
Conclusion
The aim of this experiment was to construct a binary eutectic phase diagram for the Bi-Sn alloy system. The thermal analysis method used was DSC, which performed analyses of seven different compositions ranging from 100% Bi to 100% Sn. The experimental data gathered from the thermograms provided the melting, liquidus, and eutectic points required to plot the phase diagram. The eutectic point seen on the experimental diagram occurred at 60at% Sn; only a 1% difference to diagrams from literature. Varying differences in data from the heating and cooling runs can be seen occurring mostly at higher temperatures. It was assumed that the temperature differences were caused from undercooling, potentially resulting with delayed phase transitions and mechanical irregularities. It was stated that coring occurs when nonequilibrium cooling is experienced, preventing diffusion from achieving equilibrium. Atomic diffusion was termed as a time and temperature dependent process; where time reductions correlate with higher temperatures. It was said that homogenisation annealing can repair a cored microstructure by reheating it to a temperature where atoms diffuse into equilibrium.
The experiment revealed how fundamental thermal analyses and phase diagrams are to the engineering field. The material properties determined by these experiments ensures that materials can be selected confidently for specific requirements.
References
Stodghill, SP 2010, ‘Thermal analysis – a review of techniques and applications in the pharmaceutical sciences’, American Pharmaceutical Review, vol. 13, no. 2, pp. 29-36, viewed 22 April 2017, http://www.americanpharmaceuticalreview.com/
Olofinjana, A 2017, ENG301, Lecture 3b: Use of thermal analysis to study phase transitions, University of the Sunshine Coast, Sippy Downs.
Engineering and Physical Sciences Research Council (EPSRC) & Durham University n.d., DSC, viewed 24 April 2017, http://www.hydrateweb.org/dsc
Bhadeshia, H n.d., Differential scanning calorimetry, viewed 24 April 2017, http://www.phase-trans.msm.cam.ac.uk/2002/Thermal2.pdf
Bhadeshia, H n.d., Thermal analysis techniques, viewed 24 April 2017, http://www.phase-trans.msm.cam.ac.uk/2002/Thermal1.pdf
H, Okamoto 2010, Journal of Phase Equilibria and Diffusion vol. 31, no. 2 [Appendix 1]
Callister, WD & Rethwisch, DG 2014, Materials science and engineering an introduction, 9th edn, Wiley, USA.
Askeland, DR, Fulay, PP & Wright, WJ 2011, The science and engineering of materials, 6th edn, Cengage Learning, USA.
Parisi, A & Plapp M 2008, ‘Stability of lamellar eutectic growth’, Acta Materialia, vol. 56, no. 6, pp. 1348-57, doi:10.1016/j.actamat.2007.11.037
Appendix 1: Published Bi-Sn Equilibrium Phase Diagram
Congratulations @engenuity! You have completed some achievement on Steemit and have been rewarded with new badge(s) :
Click on any badge to view your own Board of Honor on SteemitBoard.
For more information about SteemitBoard, click here
If you no longer want to receive notifications, reply to this comment with the word
STOPCongratulations @engenuity! You have received a personal award!
Click on the badge to view your Board of Honor.
Do not miss the last post from @steemitboard:
Congratulations @engenuity! You received a personal award!
You can view your badges on your Steem Board and compare to others on the Steem Ranking
Vote for @Steemitboard as a witness to get one more award and increased upvotes!