IT'S THE INTERNET, STUPID! "UFO SIGHTINGS HIT ALL-TIME HIGH"

98,000 UFO sightings in 100 years
I love analyzing public data. To me a night spent trawling some repository or archive, crunching the numbers and plotting charts, is a night well spent. Pulling up answers from a sea of raw data sometimes feels like having a sixth sense.
For the last few months I've been playing around with a large dataset of UFO reports. It is hosted online by the National UFO Reporting Center, or NUFORC (USA), and contains details on more than 98,000 UFO reports from around the world since 1906.
In this post, I’ll take you through some interesting trends I've observed in the NUFORC data. My goal is to shed light on the role of internet access in American UFO reporting trends.
An all-time high
Did you see the news reports that UFO sightings had "hit an all-time high" back in February?
Someone analyzed the NUFORC dataset, publishing this finding on their blog. It went viral fast: within a week Fox had put it in the headlines, and it was soon being cited by bloggers and websites of varied color and flavor; popping up in a timeline or two.

Having analyzed the data myself I can confirm: we are indeed near the top of a giant spike in UFO sightings since 1906 (the actual "all time high" was in 2014). See my chart below.

Interesting stuff! But this is only the beginning of the story. You see, the author of our now-viral blog post makes another claim, one which this post, the one you're reading now, shows is misguided. Hear me out.
It's the internet, stupid
So the most salient feature of chart one (above) is this skyrocket in reporting after about 1994. What's causing that? As I'll show below, the answer is probably internet access.
If that seems obvious to you, you're not alone--everyone I mention this to has said the same thing: "that makes sense". Yet our viral blog post disagrees, concluding that internet access does not influence rates of UFO reporting.
Rather than explain why that conclusion is wrong (do read the viral blog post: it'll be obvious to anyone who's taken stats 101 that there are major problems), I'm just going to show here that a strong relationship between internet access and UFO reporting does in fact exist.
Here is the set up: internet access varies country to country and year to year, and according to the NUFORC data, so does UFO reporting. We would want, therefore, to consider both these variables (UFO reporting and internet access) across time, and country by country, if we were going to test for an association between them.
UFO reports for 173 countries/territories total exist in the NUFORC data, yet the vast majority of sightings (89%) come from only one country: the United States of America. Look at chart two below, and consider that the numbers only go down from there.

Here I'll test for a predictive statistical relationship between internet access and UFO reporting--in the USA only. The idea is that each of the other 172 countries in the NUFORC data should get it's own analysis in the future.
Feel free to download the data and do these analyses yourself: Here's my cleaned and coded spreadsheet pulled from the NUFORC UFO reporting database.
Let's begin: we'll start with a visual assessment. Compare the line chart for UFO sightings in the USA to the line chart for changing rates of internet access over time in the USA (charts 3 and 4, below). We can see an obvious and uncanny analog in the "shape" of these lines: in both charts, we see steady increases after 1995, with both variables beginning relatively near zero before that point. Around 2010, we also see these analogous jumps in magnitude of both variables. Something looks connected here, across time.

Next, let's use regression analysis to test this connection statistically. With regression analysis, we are trying to figure out how much of the variance in UFO sightings across time is explained by the variance in internet access across time.
I've plotted the data at issue on a scatter plot, where the horizontal axis (X) is the number of UFO sightings in the USA per year, and the vertical axis (Y) is amount of internet access in the USA per year (see chart 10 below).
We run a line through the center of the cloud of dots on your scatterplot, and measure the distance of each dot from the point on the line directly below it. We then analyze these distances to generate a coefficient between zero and one (.00-1.00) that expresses how well the Y variable (internet access) predicts the X variable (UFO sightings), i.e. how much variance in X is explained by the variance in Y.

Results: As you can see in the chart above, our regression analysis revealed 83% (R2=.83) of all variance in UFO sightings per year in the USA is predicted by the observed variance in rate of internet access by year in the USA. That is, in case you don't know, a very large amount.
See this introduction to regression analysis as needed
Now, before you shatter my brain with the statement correlation is not causation, I ask that you please consider that correlation can suggest causation--and does so all the more when the correlation you're looking at is really strong. Plus, buddy, the .83 value above is not a correlation coefficient, it’s an R Squared value. The correlation coefficient for the relationship between these variables is .91, which is uncannily strong, to the point that it almost suggests we're comparing the same variable.
We are safe saying: a very strong, and plausibly-causal, relationship between internet access and UFO sightings exists in the USA.
This is a conclusion that won't be making any headlines. As I already said, we would have to repeat similar analyses on the other countries in the NUFORC dataset if we wanted to say anything about such an association beyond the USA.
Augmenting the conclusion: Smart phones
Let’s examine an interesting detail in the data that I think augments the conclusion above.
Look at chart 6, below, at rate of smartphone adoption in the USA since 2005, and rate of internet access since 1994. Notice that around 2010 there is again that shared bump in the data that we saw in an earlier chart.
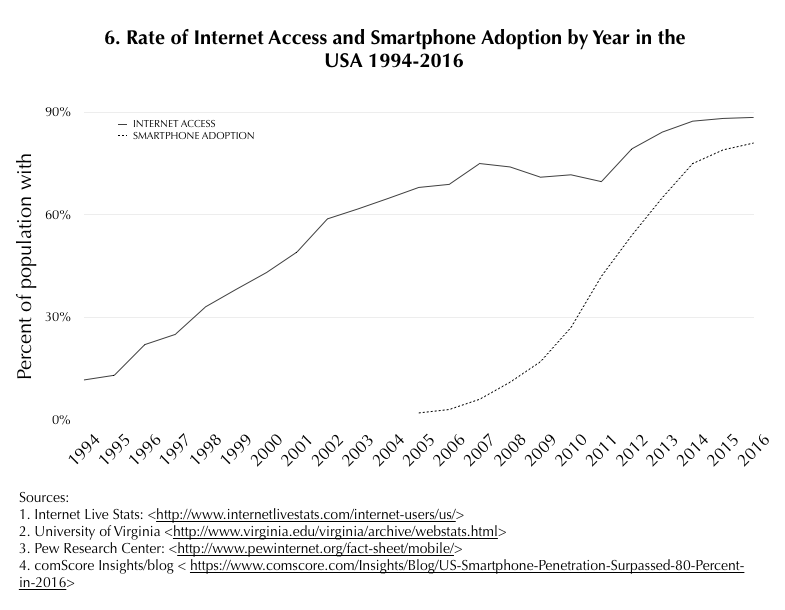
Okay, chart seven (below) is similar to chart 6 (above), but it also includes rate of UFO reporting. I've standardized the scores of all three of these variables in chart 7 (i.e. rescaled them to match-up in magnitude and in unit of measurement. For more info on standardization of variables, visit this link). Because my variables are now standardized, I can lay them on top of each other and compare the shapes of their lines directly.
Here's what I take from this chart, tentatively: the ‘bump’ in the data that I keep mentioning looks like Americans’ smartphone adoption pushing up the floor for number of internet users, thus causing more UFO sightings.

Smartphone access increases levels of access to online life by mobilizing it: those who were already online are now online even more because they always have their smartphone, while those who weren’t online before might find online life easier to approach for the first time than would be the case on a PC (this seems intuitive).
As the population online increases, so does the rate of occurrence of all the things people do, and that includes reporting UFOs.
This idea will guide hypotheses in my future work on this data. At face value I think the chart above at least hints at the validity of my study's variables as they relate to each other.
References
- National UFO Reporting Center (2017). Report Database. http://www.nuforc.org/
- Montfort, S. (2017) I Want to Believe: UFO Sightings Around the World https://vizthis.wordpress.com/2017/02/21/i-want-to-believe-ufo-sightings-around-the-world/
- Fox News (2017) UFO sightings hit all-time high, report says. http://www.foxnews.com/science/2017/02/28/ufo-sightings-hit-all-time-high-report-says.html
- Stat Trek: What is Linear Regression? http://stattrek.com/regression/linear-regression.aspx
- Statistics How-To: Standardized Variables http://www.statisticshowto.com/standardized-variables/
Chart Data/References
- National UFO Reporting Center (2017). Report Database. http://www.nuforc.org/
- Internet Live Stats: USA. http://www.internetlivestats.com/internet-users/us/
- University of Virginia: 1994 -2008 - 14 Years of Web Statistics http://www.virginia.edu/virginia/archive/webstats.html
- Pew Research Center: Mobile Fact Sheet http://www.pewinternet.org/fact-sheet/mobile/
- comScore Insights/blog: US Smartphone Penetration Surpassed 80 Percent in 2016: https://www.comscore.com/Insights/Blog/US-Smartphone-Penetration-Surpassed-80-Percent-in-2016
Images
Thanks for reading.
Love this study! So interesting! Have never really thought much about the relationship between UFO sightings and internet access. Resteemed!
Much appreciated as always.
I expect more UFO sightings in the future, not necessarily because the number of UFO's is increasing but because experiences like sightings and abductions are becoming more recognisable to the human psyche. Perhaps the future of human thinking is that people will understand them as seemingly extra-human intelligence which they can communicate with, whether they exist in consensus reality or not.
Thank you for taking the time to read/respond.
Its good stuff. I've been fascinated by UFO's for ages and once, when in a state of altered consciousness I thought I saw one zip behind a cloud, but didn't trust my perception. I think more people should trust their perceptions less ;)
Very cool post. The Internet may have created more avenues for people to report what they have seen, but nothing to explain reporting anywhere near these levels (in other words, I think you're right). At other times in history, it's been witches, dragons, devils, and ghosts... whatever seems to be out there in the collective consciousness of society. I'm not discounting aliens, but most sightings are junk. Meanwhile, people who visited Disney parks in years past have related that they have fond memories of having seen Bugs Bunny there, even though that is not a Disney character. :)
well this is smartest idea i heard about lately. i would like to see a comparable study of UFO sightings and airing of popular Sci fi movies and shows. its 89 from US? well US has made most of sci fi movies and tv shows too. it could be even more detailed, to read the testimony and compare with tv aliens who aired in that time.
Thanks for your feedback, and for your suggestion, which is totally practical in terms of execution: Someone could gather data on number of SciFi TV/FILM releases across time (IMDB?) and compare it to rate of UFO sightings in the NUFORC data. Yes, that would be interesting.
Very interesting post. I believe in these things
Thanks sir... for help me....
@deeallen
Upvoted and followed man! Great stuff honestly! I wrote an article that has these proofs more than 500 years old...
Please take a look at article HERE
I dont need upvote or anything, just read it and comment please. I'm very interested in your opinion.
Im preparing Episode 02 with more nasty details and examples :D
Thanks
Luci
Interesting info
Awesome reporting and data crunching. Thanks a bunch!!
Exactly! Hence my last post of a 'suspicious' ring ufo in the clouds.