Set Theory & SQL Like Functions In R With dplyr
Hi. In this post, I demonstrate the use of the dplyr package in R to perform some SQL like functions. The math field of set theory is used here as it helps with understanding.
Setting Up The Data
To start, load in the dplyr package with the code library(dplyr). Next, I create some sample "fake" data in R.
> colours1 <- c("Red", "Green", "Blue", "Yellow", "Black", "Maroon", "Purple", "Orange")
>
> counts1 <- c(17, 10, 8, 12, 20, 15, 8, 11)
> # SQL & Set Theory Like Functions In R With dplyr
> # Ref: https://stackoverflow.com/questions/2851015/convert-data-frame-columns-from-factors-to-characters
>
> # Sample Data Of Two Classrooms:
>
> library(dplyr)
>
> colours1 <- c("Red", "Green", "Blue", "Yellow", "Black", "Maroon", "Purple", "Orange")
>
> counts1 <- c(17, 10, 8, 12, 20, 15, 8, 11)
>
> # Create table:
> class1 <- data.frame("Colour" = colours1, "Count" = counts1, stringsAsFactors = FALSE)
>
> # Show table:
> class1
  Colour Count
1    Red    17
2  Green    10
3   Blue     8
4 Yellow    12
5  Black    20
6 Maroon    15
7 Purple     8
8 Orange    11
>
> colours2 <- c("Red", "Green", "Blue", "Grey", "Black", "Coral", "Yellow", "Orange")
>
> counts2 <- c(20, 9, 18, 17, 10, 5, 9, 21)
>
> # Create table:
> class2 <- data.frame("Colour" = colours2, "Count" = counts2, stringsAsFactors = FALSE)
>
> # Show table:
> class2
  Colour Count
1    Red    20
2  Green     9
3   Blue    18
4   Grey    17
5  Black    10
6  Coral     5
7 Yellow     9
8 Orange    21
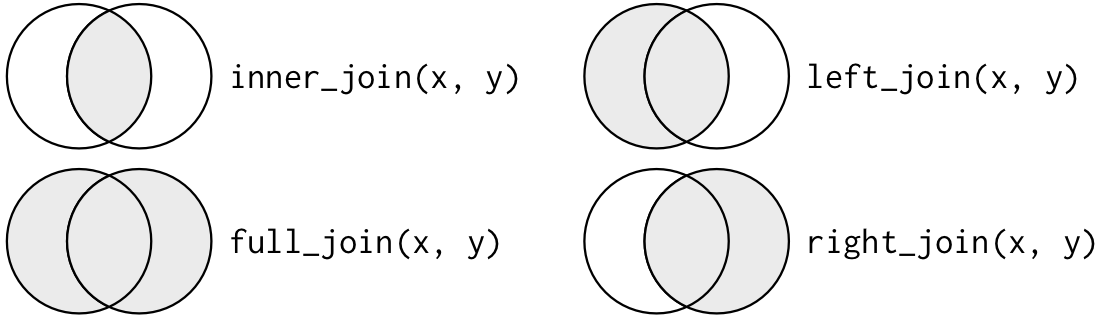
dplyr's Join Functions
Left Join
The left join shows rows from the left side data frame. In this case, it is from class1.
Right Join
With the right join, rows appear from the right side. The rows are from class2.
Inner Join
The inner join contains rows where there are no NA/missing values from each column.
Full Join
The full join contains all the rows and data from both class1 and class2.
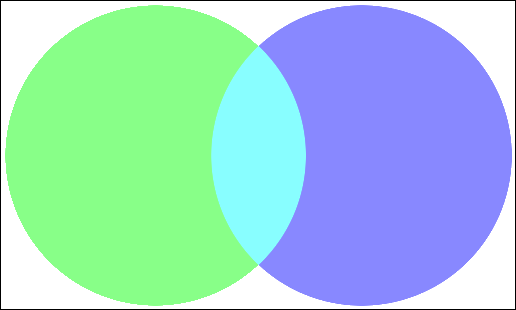
For those familiar with Venn diagrams and set theory, here is a nice summary visual. Visuals such as these help with memorization.
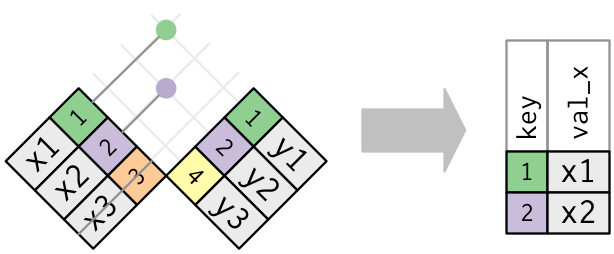
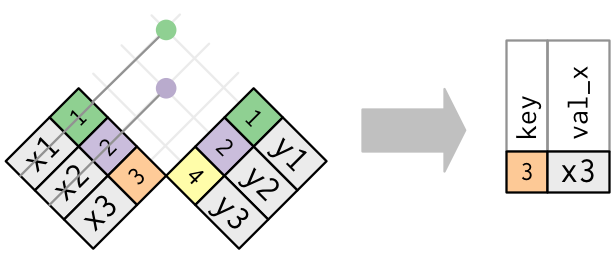
This website link: http://r4ds.had.co.nz/relational-data.html contains a nice comparison chart between R's dplyr package and SQL queries. [Screenshot image below from Snipping tool.]
Semi Joins & Full Joins
The dplyr package also have semi joins and full joins. These are somewhat similar to left joins but not quite.
Semi Join
Anti Join
Set Operations In dplyr
For this section, I create two new sample tables in R.
The union, intersect and setdiff() functions are illustrated in the image below.
References & Resources
- R For Data Science Book [Online Version] - Chapter 13: http://r4ds.had.co.nz/relational-data.html (For Some Of The Images)
- R's dplyr Cheatsheet
Awesome lesson! I'd love to follow more folks like you who post educational material like this (I'm currently learning app and web dev).
There is a group of us who post educational material in the fields of programming, math/stats, education and more.
I'm currently learning a bit of machine learning and some AI topics in R. Depending on time, I want to transition into Python.
Super high quality post. Think I'll check out that book you listed in the references - "R for Data Science" (saved it to my evernote). I'm also getting seriously back into programming/python with an intention to make apps for platforms like Steemit/Bitshares as well as exploring AI/machine learning.
I'd be interested in getting involved in the group you're talking about, I think the content I'll be putting up would be a good fit - starting with a walk through of a beginner programming book in Java.
Thank you for your comment. I am glad people liked this.
This post is heavily based from the dplyr Cheatsheet link and the online resource. There are other good resources for R that I have used.
For now I am using R to sharpen my skills in programming and getting into AI/machine learning. I do hope to transition into Python soon. (I come from a math/stats background focused on stochastic calculus for finance and simulations. )
About the group, I've should've worded it better. The group referred to a few individual Steemians who have been posting educational content in the fields of math, programming, science, education and the like. There is no official group nor I am part of one.
Thanks @dkmathstats