The Greatest Mathematical Paradox Ever
Hi everyone!
Surely you remember my recent article about the Monty Hall problem. Today I decided to tell you about two interesting mathematical paradoxes, which are also very interesting and have a certain application in life.
Simpson's paradox
Simpson's Paradox – it is when the trend that is observed in the grouped data gets directly opposite when these groups are combined.
Suppose there are four hats (two black and two grays), 41 chips (23 colored and 18 white) and two tables (A and B). Chips are spread across the hat in such way:
In the black hat on table A there are 5 colored and 6 white chips.
In the gray hat on table A there are 3 colored and 4 white chips.
In the black hat on table B there are 6 colored and 3 white
chips.In the gray hat on table B there are 9 colored and 5 white chips.
Suppose that you want to get a color chip.
If you are in table A, then the probability of getting a color chip out of the black hat is 5/11 = 35/77, and out of the gray hat at the same table - 3/7 = 33/77; thus it is more likely to pull colored chip out of a black hat, than out of a gray.
If you are near the table B, then the probability of getting a colored chip out of the black hat is 6/9 = 28/42, and out of the gray hat - 9/14 = 27/42; so again it is more likely to pull colored chip out of a black hat, than out of a gray.
Let’s suppose now that the chips from two black hats are folded into one black hat on table B, and chips from gray hats are in a gray hat on the table B. At first glance, it would be logical to suppose that the probability of getting a colored chip out of black hat is higher than out of gray. But this is not true:
the probability of getting a colored chip out of a black hat on B table is equal 11/20 = 231/420.
the probability of getting a colored chip out of a gray hat on table B is equal 12/21 = 240/420.
It means that there are more chances to get a colored chip out of gray hat than out of a black.
Application in the life
Once there was medical research, "What kind of treatment is best for kidney stones".
There were 2 Treatment methods - Treatment A and Treatment B. The results were:
| Method A | Method B | |
|---|---|---|
| Small stones | Group 1: 93%(81/87) | Group 2: 287%(234/270) |
| Large stones | Group 3: 73%(192/263 | Group 4: 69%(55/80) |
| Total | 78%(273/350) | 83%(289/350) |
The percentage shows the successful cure cases.
What do we have from these results? Method A was better than method B in the case of small stones and in the case of large stones, but nevertheless, the result by the total of method A looks worse than method B.
Watch this video to better understand what I'm talking about below.
It would seem that this is nonsense, contrary to common sense. Why did it happen? Because the groups weren’t chosen independently. Method A was considered more serious by doctors so it was used for situations with large stones, and patients with mild cases were in the group 2 for which method B was used. Since the cases were easier, then the results of treatment were more successful, despite the use of less effective methods than in group 3 consisting of severe cases, but being the main component of method A.

Simpson's Paradox shows that we should not blindly trust all beautiful conclusions from the results of opinion polls and unprofessional, from the point of view of statistics, experiments.
This paradox will need all your attention
The disappearance of the cells - known class of problems of figures transposition, in which description there is always a disguised mistake.
This problem was invented by an amateur magician from New York, Paul Curry in 1953.
The problem of the triangle
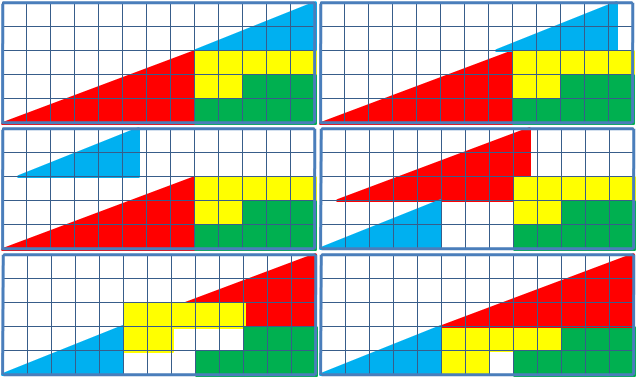
There are a right triangle 13*5 cells, made up of 4 parts. After a transposition of the components, while the original visual proportions are the same, there have appeared one free cell.
Sq. of a painted figures, of course, are equal to each other (32 cells), however, they visually look like triangles 13*5 in fact it is not so, and they have got different sq. (S13 ×5 = 32.5 5 cells). That is a mistake, disguised in the problem, the initial figure was named as the triangle (in fact it is - a concave quadrangle).
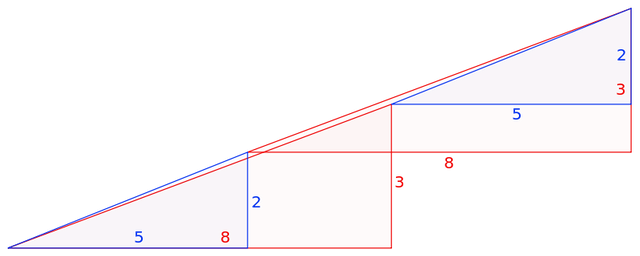
This is clearly evident in this picture- "hypotenuse" of upper and lower figures pass through different points: (8,3) at the top (5.2) at the bottom. The secret is the characteristic of the blue and red triangles. If we impose the top and bottom pieces 13 × 5 to each other, between their "hypotenuses" there would be a parallelogram, and which contains an "extra" area.
If you haven't understood yet - go here and check it up
I hope that you liked this article and now understand that maths is really wide and interesting and what is more important - so useful in our life!
Ah so this is the chocolate bar trick :D
Fantastic and interesting article.
Thanks so much for including the video's as well, they really made it clear and easy to understand. I always knew people used statistics to lie but I've never seen such clear evidence of how it's done.
Thanks so much for you post, followed and upvoted.
thanks, @jeza.
Stay tuned to learn more on popular science. I'm trying to develop this rubric here, at Steemit
Paradoxes cannot exist in the real world. They are internal irregularities in the arguments put forth
My head starts spinning, trying to understand the first proposition. I get watchful when examples with high and seemingly randomly chosen numbers are used. It often is a way to camouflage a flaw in the argument. Just saying .-)
I would like to have seen more than such articles.
Thank you krishtopa, I love mathematical paradox,
but this woman is not
lol, funny gif.
Follow me to learn first about such articles
Ok, I follow you @krishtopa!
jejjejeej
Thanks a lot Kate! I love the chips-and-hats example to introduce your post.
Btw, a little typo:
287% is a bit too much ^^
This simple trick, can boggle the smartest of non-mathematicians....