BTC TA for 09/27/2019
THIS POST WAS WRITTEN IN PORTUGUESE, ENGLISH AND SPANISH LANGUAGES. FOR THE SPANISH AND ENGLISH VERSIONS, PLEASE KEEP SCROLLING DOWN THE PAGE!
PORTUGUESE VERSION:
Boa tarde Steemians, tudo bem?
No post de hoje, farei outra análise técnica do preço do BTC, com base na ferramenta clássica de médias móveis exponenciais, canais de tendência e RSI.
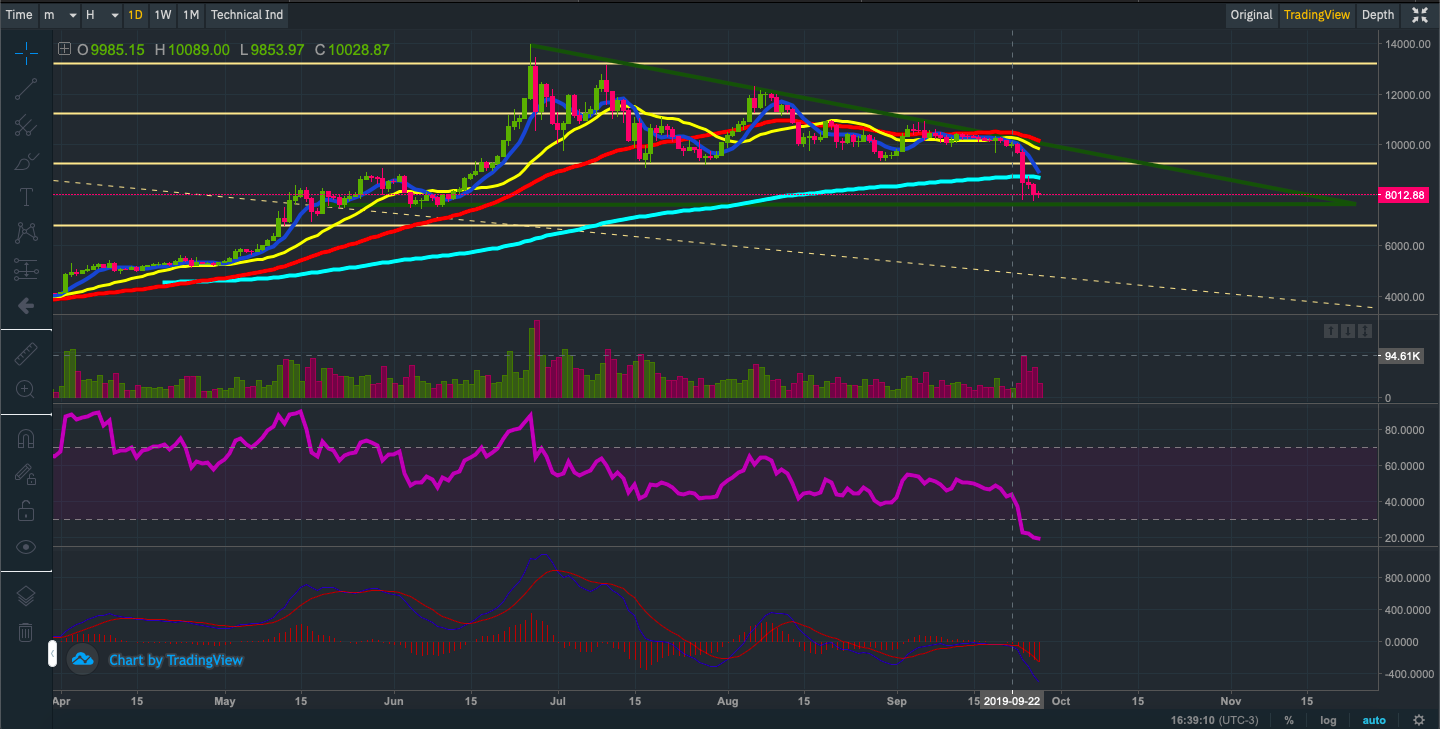
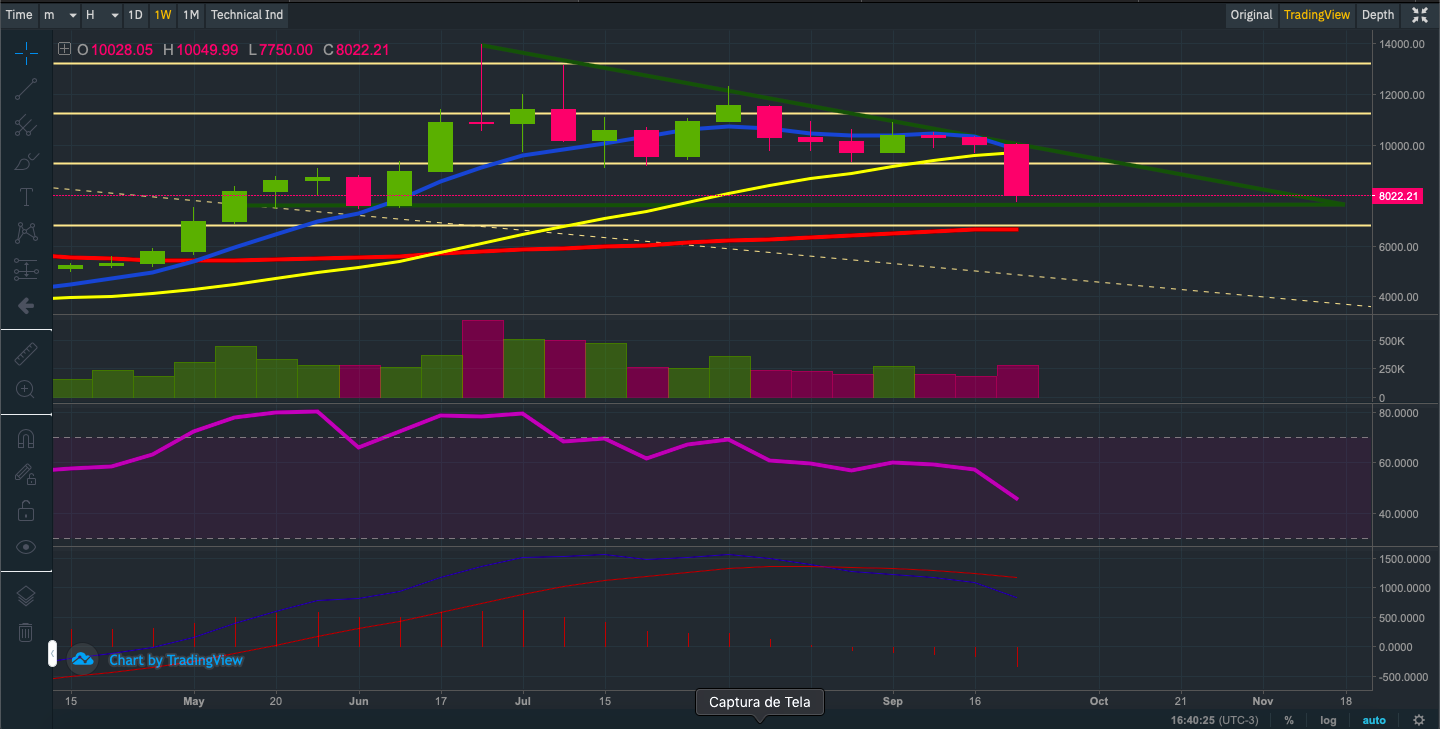
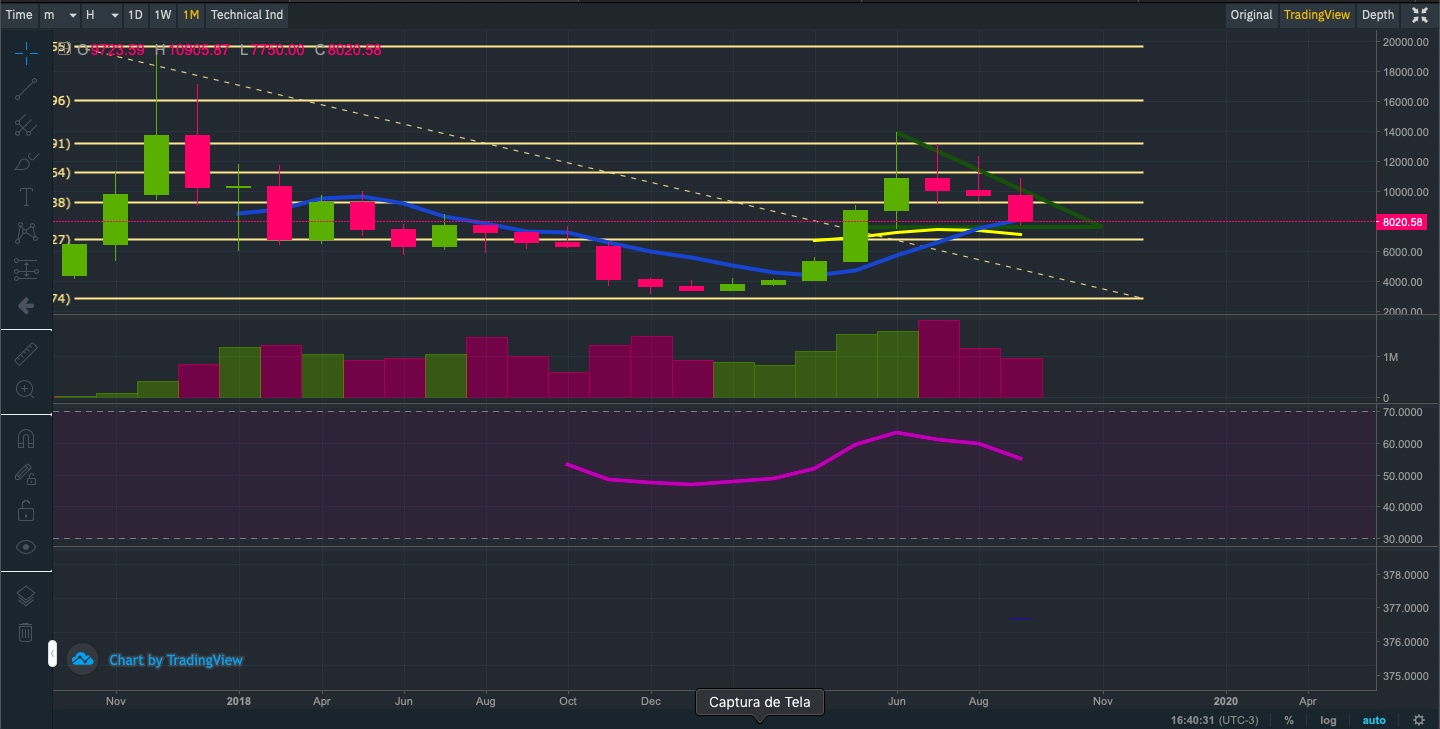
Para realizar essa análise, usei as visualizações do gráfico de velas da Binance por 1 dia, 1 semana e 1 mês, respectivamente, juntamente com as curvas médias exponenciais de 7, 21, 50 e 200 dias, canal de tendência de preços. e RSI desde 02/04/2019. Dessa forma, tenho um escopo mais amplo para poder fazer uma análise mais segura com uma série histórica maior. Vale lembrar que essa análise visa a médio e longo prazo.
As médias móveis exponenciais são os preços médios para um determinado período de tempo, com o período mais recente tendo o maior peso na construção de curvas. Assim, além de fornecer uma visualização de uma tendência, eles reagem mais rapidamente levando em consideração a volatilidade dos preços de mercado no curto prazo.
Média móvel exponencial de 7 dias (EMA 7): azul escuro
Média móvel exponencial de 21 dias (EMA 21): amarelo
Média móvel exponencial de 50 dias (EMA 50): Vermelho
Média móvel exponencial de 200 dias (EMA 200): azul turquesa
Canal de tendência: Linha verdes
** ATENÇÃO: ESTE POST TEM SOMENTE UM OBJETIVO EDUCACIONAL E NÃO DEVE SER TOMADO COMO BASE PARA DECISÕES DE INVESTIMENTO. A ANÁLISE SE REFERE APENAS À MINHA OPINIÃO E NÃO SOU RESPONSÁVEL POR QUALQUER GANHO OU PERDA DE OPERAÇÕES COM BASE NA ANÁLISE TÉCNICA DE PREÇOS. **
Vamos lá!
Fonte da imagem: binance.com
Fonte da imagem: binance.com
Fonte da imagem: binance.com
Como você pode ver nos gráficos acima, a média móvel de 7 dias está abaixo das demais EMAs. Isso geralmente indica uma tendência de baixa nos preços. Nos últimos 3 dias vimos que o canal foi rompido e eu acredito que estejamos em um bear market temporário (apesar das correções não terem sido significativas). A longo prazo, entretanto, ainda creio que estejamos em um bull market, pois temos vários indicadores nesse sentido, como o lançamento da Bakkt (e seu provável aumento do volume de BTCs negociados (o que deve impulsionar o preço para cima novamente), bem como o halving do Bitcoin que deve ocorrer em maio de 2020.
O RSI está queda e no patamar de 19,31, o que pode corroborar o bear market temporário sobre o qual eu falei acima.
Apesar de nos encontrarmos no bear, eu acredito que estamos em uma fase de acumulação e que, a qualquer momento, o BTC irá retomar a rota de alta de preços.
O próximo suporte (e também o mais forte) está na faixa dos USD$ 7.610,00e, caso seja rompido, devemos ter uma forte correção de preços (podendo chegar até a faixa da Fibonacci 0,236 nos USD$ 6.817,63).
Cabe lembrar aqui que essas Fibonaccis foram traçadas levando-se em conta a máxima histórica dos preços do BTC (de USD$ 19.798,68) desde o dia 17/12/2017.
NOTA: O canal de tendência de preços foi ajustado para refletir a correção que tivemos nos dias 28/08/2019, 19/09/2019 e 23/09/2019.
Suportes e Resistências:
Suportes:
dia 27/09 - USD$ 7.610,00
dia 28/09 - USD$ 7.610,00
Resistências:
dia 27/09 - USD$ 10.001,00
dia 28/09- USD$ 9.965,00
Resumindo: Devido a todos esses indicadores, ainda acredito que há espaço para uma possível correção dos preços do BTC (tanto no curto quanto nos médio e longo prazos), apesar da recente correção que tivemos nos últimos dias em torno de 42,50%.
Você gostou deste conteúdo? Ajude-me a manter a qualidade e as postagens regulares doando qualquer quantia em BTC, ETH ou Doge para um dos portfólios abaixo.
BTC wallet
ETH wallet
DOGE wallet:
STEEM wallet: @aotearoa
SBD wallet: @aotearoa
Juntos nós podemos fazer com que o #Steemit cresça ainda mais forte e mais rápido!
Posts Recentes:
My Actifit Report Card: September 25 2019
My Actifit Report Card: September 22 2019
My Actifit Report Card: September 21 2019
SPANISH VERSION:
Buenas tardes Steemians, ¿cómo están?
En la publicación de hoy, haré otro análisis técnico de los precios de BTC, basado en la herramienta clásica de promedios móviles exponenciales, canales de tendencia y RSI.
Para realizar este análisis, utilicé las vistas del gráfico de velas de Binance durante 1 día, 1 semana y 1 mes respectivamente, junto con las curvas promedio exponenciales de 7, 21, 50 y 200 días, canal de tendencia de precios. y RSI desde el 04/02/2019. Por lo tanto, tengo un alcance más amplio para poder hacer un análisis más seguro con una serie histórica más grande. Recuerde que este análisis apunta a mediano y largo plazo.
Los promedios móviles exponenciales son los precios promedio para un período de tiempo dado, y el período más reciente tiene el mayor peso en la creación de curvas. Por lo tanto, además de proporcionar una visualización de una tendencia, reaccionan más rápidamente teniendo en cuenta la volatilidad de los precios del mercado a corto plazo.
Media móvil exponencial de 7 días (EMA 7): azul oscuro
Promedio móvil exponencial de 21 días (EMA 21): amarillo
Promedio móvil exponencial de 50 días (EMA 50): rojo
Media móvil exponencial de 200 días (EMA 200): turquesa
Canal de tendencia: línea verde
** TENGA EN CUENTA: ESTA PUBLICACIÓN TIENE SOLO UN OBJETIVO EDUCATIVO Y NO DEBE BASARSE EN DECISIONES DE INVERSIÓN. EL ANÁLISIS SE REFIERE A MI OPINIÓN SOLAMENTE Y NO SOY RESPONSABLE DE NINGUNA GANANCIA O PÉRDIDA DE OPERACIONES BASADAS EN EL ANÁLISIS TÉCNICO DE PRECIOS. ** **
¡Vamos allá!
Fuente de la imagen: binance.com
Fuente de la imagen: binance.com
Fuente de la imagen: binance.com
Como puede ver en los gráficos anteriores, el promedio móvil de 7 días está por debajo de los otros EMA. Esto generalmente indica una tendencia a la baja en los precios. En los últimos 3 días, hemos visto que el canal se ha roto y creo que estamos en un mercado bajista temporal (aunque las correcciones no fueron significativas). A la larga, sin embargo, sigo creyendo que estamos en un mercado alcista, ya que tenemos varios indicadores a este respecto, como el lanzamiento de Bakkt (y su probable aumento en el volumen de BTC negociados (lo que debería elevar nuevamente el precio). como la reducción a la mitad de Bitcoin en mayo de 2020.
El RSI ha bajado y se encuentra en un nivel de 19.31, lo que puede corroborar el mercado bajista temporal que mencioné anteriormente.
Aunque estamos en el bajista, creo que estamos en una fase de acumulación y que en cualquier momento BTC reanudará la trayectoria de precios al alza.
El próximo soporte (y también el más fuerte) está en el rango de USD $ 7,610, y si se rompe, deberíamos tener una fuerte corrección de precios (hasta el rango de Fibonacci 0.236 a USD $ 6,817.63).
Cabe señalar aquí que estos Fibonaccis se han trazado teniendo en cuenta el máximo histórico de los precios de BTC (USD $ 19,798.68) desde el 17/12/2017.
NOTA: El canal de tendencia de precios se ha ajustado para reflejar la corrección que tuvimos el 28/08/2019, 19/09/2019 y 23/09/2019.
Soportes y Resistencias:
Apoya:
27 de septiembre - USD $ 7,610.00
28/09 - USD $ 7,610.00
Resistencias:
27 de septiembre - USD $ 10,001.00
28/09 - USD $ 9,965.00
Para resumir: debido a todos estos indicadores, sigo creyendo que hay espacio para una posible corrección de los precios de BTC (tanto a corto como a mediano y largo plazo), a pesar de la corrección reciente que tuvimos en los últimos días en torno al 42.50%.
¿Te gustó este contenido? Ayúdame a mantener la calidad y las publicaciones regulares donando cualquier cantidad en BTC, ETH o Doge a una de las carteras a continuación.
BTC wallet
ETH wallet
DOGE wallet:
STEEM wallet: @aotearoa
SBD wallet: @aotearoa
¡Juntos podemos hacer que #Steemit crezca aún más fuerte y más rápido!
Mensajes recientes:
My Actifit Report Card: September 25 2019
My Actifit Report Card: September 22 2019
My Actifit Report Card: September 21 2019
ENGLISH VERSION:
Good afternoon Steemians, how do you do?
No post of hoje, farei outra technical analysis of the preço do BTC, based on the classic ferramenta of media móveis exponentesis, canais de tendência e RSI.
To carry out this analysis, use the visualization of the Binance Candle Chart for 1 day, 1 week and 1 month, respectively, together with exponential medium curves of 7, 21, 50 and 200 days, the channel for the presentation of prices. and RSI since 04/02/2019. Dessa forma, tenho um escopo mais exemplo to be able to make a more secure analysis with a historical historical series. It is worth mentioning that this analysis visa a medium and long term.
As media móveis exponentesis são os preços médios for a certain period of time, as well as the most recent period or maximum weight in the construction of curves. Assim, besides providing a visualization of a trend, reagem more quickly by raising in volatility two market prices not cuzo prazo.
7-day exponential mobile media (EMA 7): dark blue
21-day exponential mobile dialysis (EMA 21): love it
50-day exponential mobile media (EMA 50): Vermelho
200-day exponential mobile media (EMA 200): turquoise blue
Tendency Channel: Linha Greens
** ATENÇÃO: THIS POST TEM IS ONLY A UM EDUCATIONAL OBJECTIVE AND IT SHOULD NOT BE TAKEN AS THE BASE FOR RESEARCH DECISIONS. A ANALYSIS IS REFERRED JUST À MINHA OPINIÃO E NÃO SOU RESPONSIBLE FOR ANY GANHO OU LOSS OF OPERATIONS WITH BASE ANY TECHNICAL ANALYSIS OF PREÇOS. **
Let's go!
Fonte da imagem: binance.com
Fonte da imagem: binance.com
Fonte da imagem: binance.com
As you can see the current graphics, a 7-day mobile media is abaixo das demais EMAs. Isso generally indicates a tendency of baixa nos preços. The last 3 days we saw that the channel was broken and I believe that we were in a temporary bear market (although the corrections were not significant). In the long run, meanwhile, I still thought we were in a bull market, we have several indicators that are meaningless, such as the Bakkt lançamento (e seu provável increase of the volume of negotiated BTCs (or that should boost or price to top novably), bem as or halving do Bitcoin that I should take place in 2020.
Or RSI is left and not patamar of 19.31, or that can corroborate or bear temporary market on or what eu falei acima.
In spite of the fact that we will not find no bear, I believe that we are in a phase of accumulation and that, at any time, or BTC will resume the discharge of prices.
Or next support (and also more forte) is two dollars US $ 7,610.00e, in case it is broken, we will have the right price corrections (I can check the price of Fibonacci 0.236 US $ 6,817.63).
It is worth mentioning here that these Fibonaccis foram traçadas are raised and two BTC prices (of USD $ 19,798.68) have been recorded at a historical maximum since 12/17/2017.
NOTE: Or the channel for the price adjustment adjusted to refine the corrections we have on 08/28/2019, 09/19/2019 and 09/23/2019.
Supports and Resistances:
Supports:
Day 09/27 - USD $ 7,610.00
Day 09/28 - USD $ 7,610.00
Resistors:
day 09/27 - USD $ 10,001.00
day 28/09 - USD $ 9,965.00
In summary: Due to all these indicators, I also accredit that there has been space for a two-month BTC (both not as long as we are in the middle of arms), despite the recent correction that we have spent the last few days around 42.50%.
Did you like this content? Please help me maintain quality and regular posts by donating any amount in BTC, ETH or Doge to one of the portfolios below.
BTC wallet
ETH wallet
DOGE wallet:
STEEM wallet: @aotearoa
SBD wallet: @aotearoa
Together we can make #Steemit grow even stronger and faster!
Recent Posts:
My Actifit Report Card: September 25 2019
My Actifit Report Card: September 22 2019
My Actifit Report Card: September 21 2019

ptgram power: | faça parte | grupos | projetos | membros |
| ptg shares | trilha premium | fórum externo | fórum na blockchain |
siga: | @brazine | @brazilians | @camoes | @coiotes | @dailycharity | @imagemvirtual | @msp-brasil | @ptgram-power |
This post has been promoted with @minnowbooster.
5% of the purchase will be burned and 5% sent to the @steem.dao fund as part of our ethical promotion initiative.
For further information please check this post.
This post has been promoted with @minnowbooster.
5% of the purchase will be burned and 5% sent to the @steem.dao fund as part of our ethical promotion initiative.
For further information please check this post.
This post has been promoted with @minnowbooster.
5% of the purchase will be burned and 5% sent to the @steem.dao fund as part of our ethical promotion initiative.
For further information please check this post.
This post has been promoted with @minnowbooster.
5% of the purchase will be burned and 5% sent to the @steem.dao fund as part of our ethical promotion initiative.
For further information please check this post.
This post has been promoted with @minnowbooster.
5% of the purchase will be burned and 5% sent to the @steem.dao fund as part of our ethical promotion initiative.
For further information please check this post.
This post has been promoted with @minnowbooster.
5% of the purchase will be burned and 5% sent to the @steem.dao fund as part of our ethical promotion initiative.
For further information please check this post.
This post has been promoted with @minnowbooster.
5% of the purchase will be burned and 5% sent to the @steem.dao fund as part of our ethical promotion initiative.
For further information please check this post.
Hello minnowbooster!
Congratulations! This post has been randomly Resteemed! For a chance to get more of your content resteemed join the Steem Engine Team
This post has been promoted with @minnowbooster.
5% of the purchase will be burned and 5% sent to the @steem.dao fund as part of our ethical promotion initiative.
For further information please check this post.
This post has been promoted with @minnowbooster.
5% of the purchase will be burned and 5% sent to the @steem.dao fund as part of our ethical promotion initiative.
For further information please check this post.
This post has been promoted with @minnowbooster.
5% of the purchase will be burned and 5% sent to the @steem.dao fund as part of our ethical promotion initiative.
For further information please check this post.