BTC TA for 09/21/2019
THIS POST WAS WRITTEN IN PORTUGUESE, ENGLISH AND SPANISH LANGUAGES. FOR THE SPANISH AND ENGLISH VERSIONS, PLEASE KEEP SCROLLING DOWN THE PAGE!
PORTUGUESE VERSION:
No post de hoje, farei outra análise técnica do preço do BTC, com base na ferramenta clássica de médias móveis exponenciais, canais de tendência e RSI.
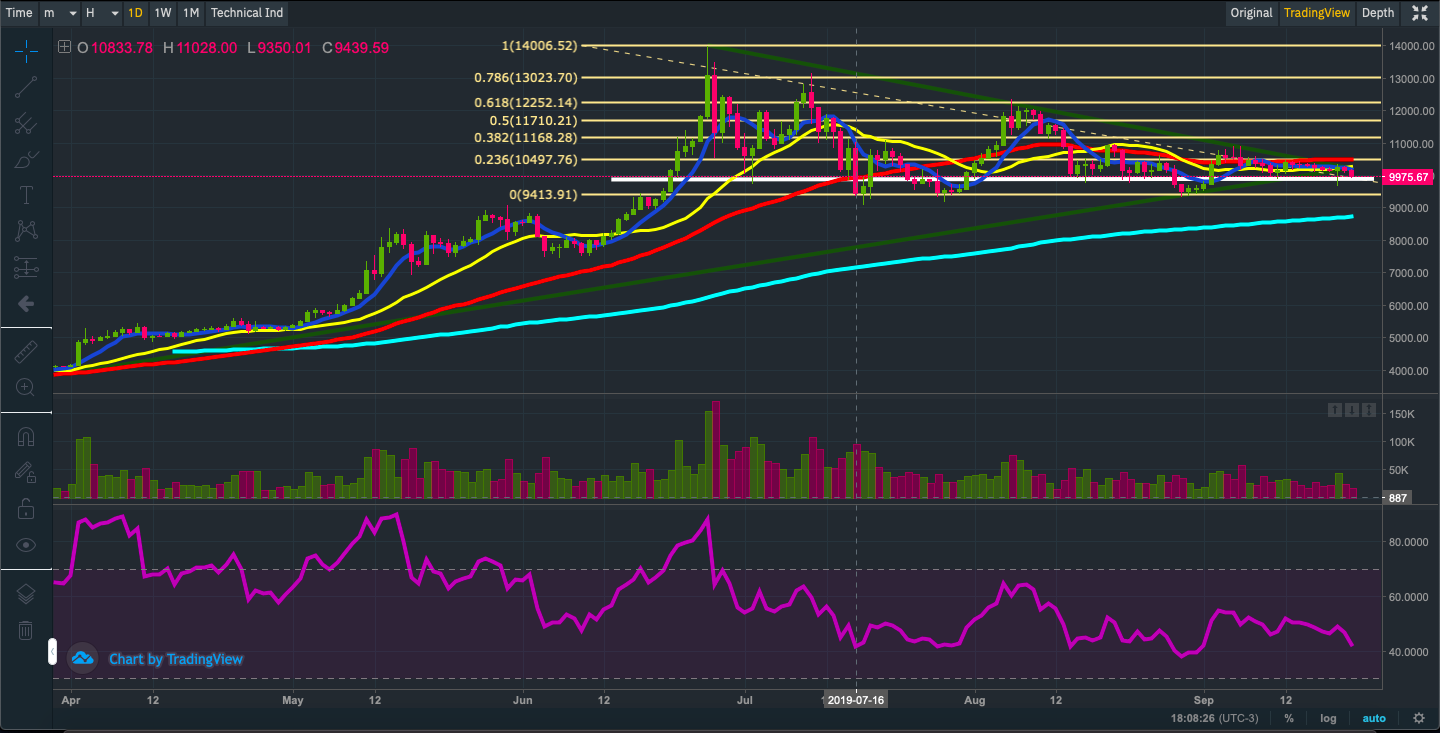
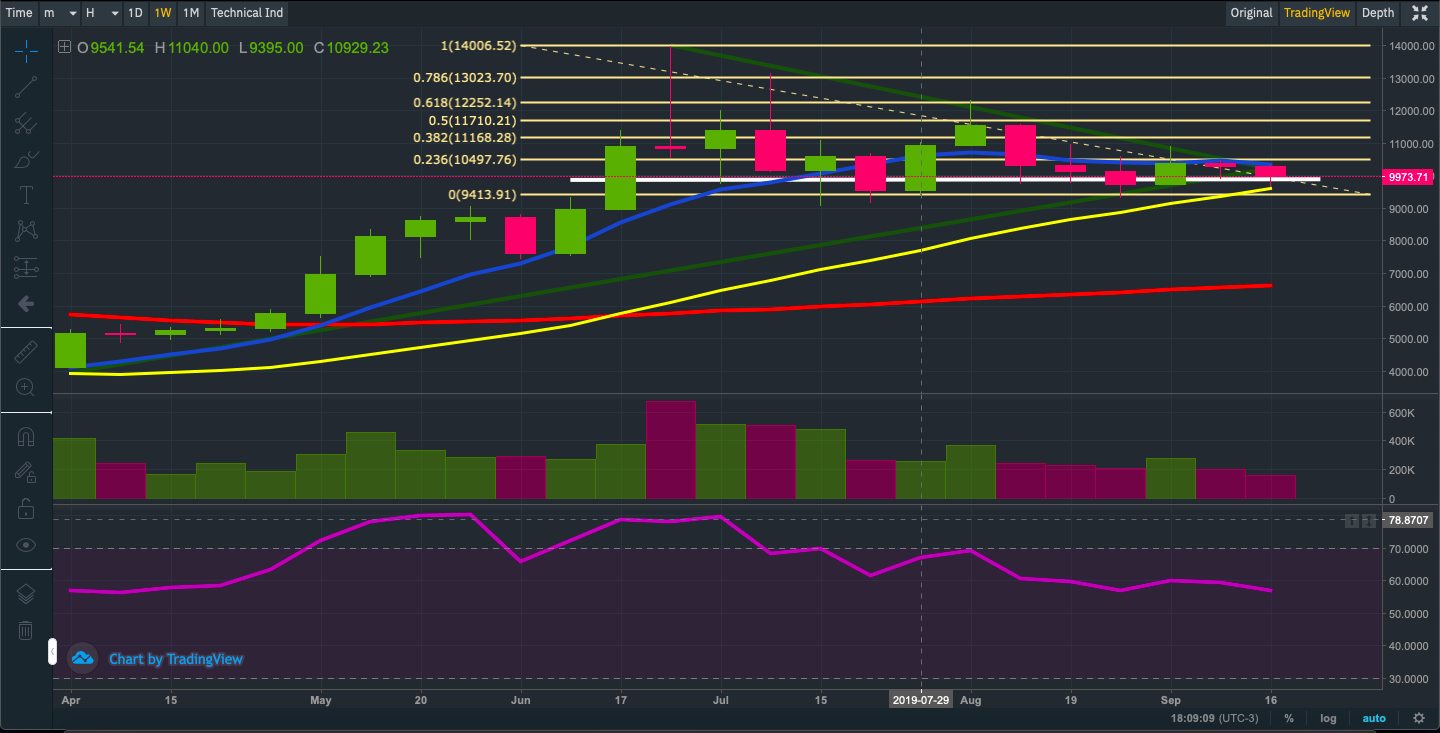
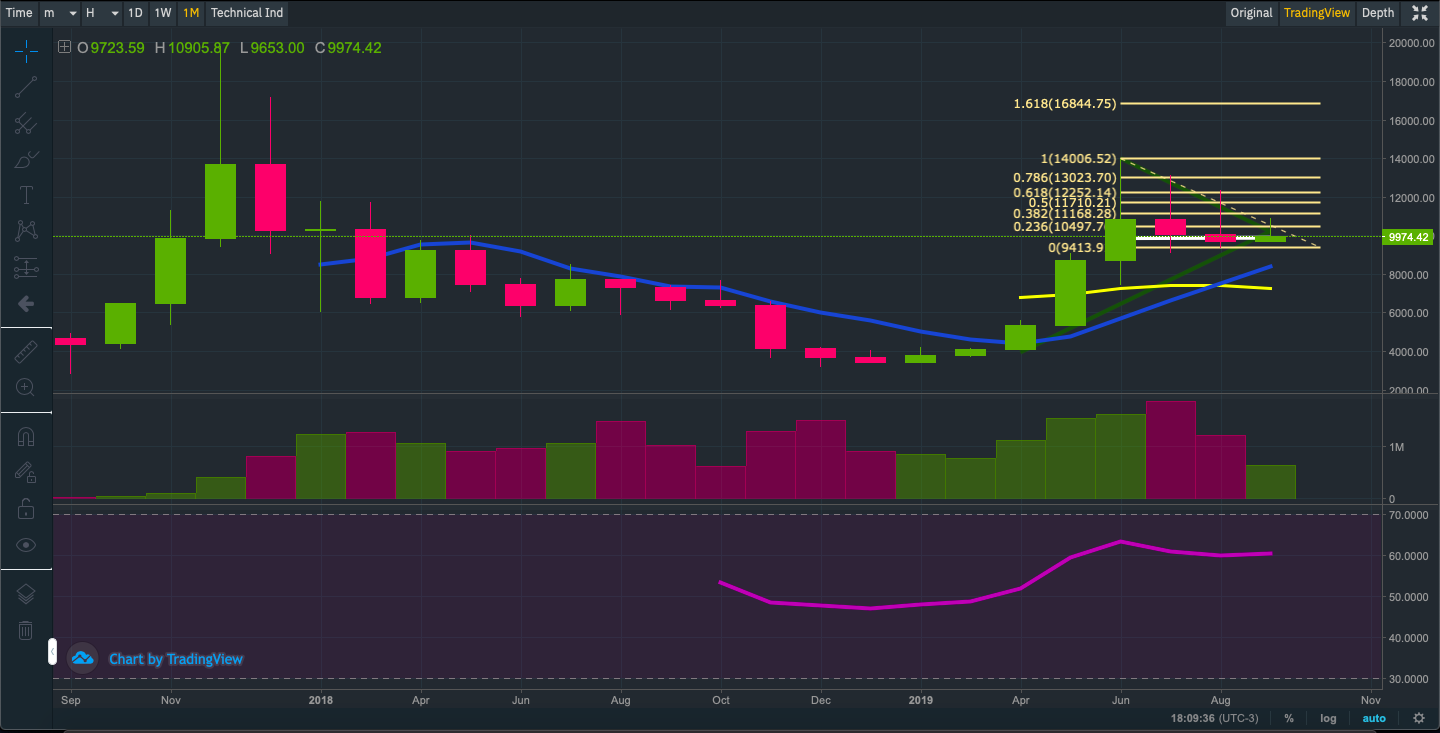
Para realizar essa análise, usei as visualizações do gráfico de velas da Binance por 1 dia, 1 semana e 1 mês, respectivamente, juntamente com as curvas médias exponenciais de 7, 21, 50 e 200 dias, canal de tendência de preços. e RSI desde 02/04/2019. Dessa forma, tenho um escopo mais amplo para poder fazer uma análise mais segura com uma série histórica maior. Vale lembrar que essa análise visa a médio e longo prazo.
As médias móveis exponenciais são os preços médios para um determinado período de tempo, com o período mais recente tendo o maior peso na construção de curvas. Assim, além de fornecer uma visualização de uma tendência, eles reagem mais rapidamente levando em consideração a volatilidade dos preços de mercado no curto prazo.
Média móvel exponencial de 7 dias (EMA 7): azul escuro
Média móvel exponencial de 21 dias (EMA 21): amarelo
Média móvel exponencial de 50 dias (EMA 50): Vermelho
Média móvel exponencial de 200 dias (EMA 200): azul turquesa
Canal de tendência: Linhas verdes
** ATENÇÃO: ESTE POST TEM SOMENTE UM OBJETIVO EDUCACIONAL E NÃO DEVE SER TOMADO COMO BASE PARA DECISÕES DE INVESTIMENTO. A ANÁLISE SE REFERE APENAS À MINHA OPINIÃO E NÃO SOU RESPONSÁVEL POR QUALQUER GANHO OU PERDA DE OPERAÇÕES COM BASE NA ANÁLISE TÉCNICA DE PREÇOS. **
Vamos lá!
Fonte da imagem: binance.com
Fonte da imagem: binance.com
Fonte da imagem: binance.com
Como você pode ver nos gráficos acima, a média móvel de 7 dias está abaixo da EMA 21. Isso pode indicar uma tendência de correção de preços, como geralmente quando as médias de curto prazo (EMA 7) estão acima de outras médias. A longo prazo, isso provavelmente indica uma bandeira de alta nos preços e, quando cruza para baixo, temos o oposto. Portanto, como temos a EMA 7 abaixo da EMA 21, ainda podemos ter algumas correções e quedas de preços, embora eu acredite que essa correção (se houver) deve ser bem pequena.
O RSI é lateralizado em torno de 42,10, o que pode indicar a conclusão da recente correção que tivemos nos últimos 87 dias nos preços do BTC.
Continuamos com um cenário um tanto confuso, pois os indicadores de longo prazo indicam um aumento, enquanto os de curto prazo indicam um declínio. Isso pode se traduzir em uma possível continuação da tendência de correção de preços que podemos observar desde 26/06/2019, quando atingimos o ATH (All Time Heights) dessa última onda (mas não era o histórico BTC ATH).
O final desse canal de tendência (independentemente do tipo de visualização usado) ocorreu hoje (dia 21/09/2019) e o mercado ainda continua lateralizado. Isso é um tanto estranho, pois deveria ter havido alguma movimentação. O triangulo que havia se formado é, em geral, uma bandeira de alta de preços. Eu, pessoalmente, acredito que estamos em uma fase de acumulação e que, a qualquer momento, o BTC irá retomar a rota de alta de preços. Entretanto como o triangulo ascendente foi rompido apenas hoje precisamos aguardar que essa tendência se confirme.
NOTA: O canal de tendência de preços foi ajustado para refletir a correção que tivemos nos dias 28/08/2019 e 19/09/2019.
Resumindo: Devido a todos esses indicadores, ainda acredito que há espaço para uma possível correção dos preços do BTC (tanto no curto quanto nos médio e longo prazos), apesar da recente correção que tivemos nos últimos dias em torno de 27,33%.
Você gostou deste conteúdo? Ajude-me a manter a qualidade e as postagens regulares doando qualquer quantia em BTC, ETH ou Doge para um dos portfólios abaixo.
BTC wallet
ETH wallet
DOGE wallet:
STEEM wallet: @aotearoa
SBD wallet: @aotearoa
Juntos nós podemos fazer com que o #Steemit cresça ainda mais forte e mais rápido!
Posts Recentes:
My Actifit Report Card: September 18 2019
My Actifit Report Card: September 15 2019
SPANISH VERSION:
Buenos días Steemians, ¿cómo están?
En la publicación de hoy, haré otro análisis técnico de los precios de BTC, basado en la herramienta clásica de promedios móviles exponenciales, canales de tendencia y RSI.
Para realizar este análisis, utilicé las vistas del gráfico de velas de Binance durante 1 día, 1 semana y 1 mes respectivamente, junto con las curvas promedio exponenciales de 7, 21, 50 y 200 días, canal de tendencia de precios. y RSI desde el 04/02/2019. Por lo tanto, tengo un alcance más amplio para poder hacer un análisis más seguro con una serie histórica más grande. Recuerde que este análisis apunta a mediano y largo plazo.
Los promedios móviles exponenciales son los precios promedio para un período de tiempo dado, y el período más reciente tiene el mayor peso en la creación de curvas. Por lo tanto, además de proporcionar una visualización de una tendencia, reaccionan más rápidamente teniendo en cuenta la volatilidad de los precios del mercado a corto plazo.
Media móvil exponencial de 7 días (EMA 7): azul oscuro
Promedio móvil exponencial de 21 días (EMA 21): amarillo
Promedio móvil exponencial de 50 días (EMA 50): rojo
Media móvil exponencial de 200 días (EMA 200): turquesa
Canal de tendencia: líneas verdes
** TENGA EN CUENTA: ESTA PUBLICACIÓN TIENE SOLO UN OBJETIVO EDUCATIVO Y NO DEBE BASARSE EN DECISIONES DE INVERSIÓN. EL ANÁLISIS SE REFIERE A MI OPINIÓN SOLAMENTE Y NO SOY RESPONSABLE DE NINGUNA GANANCIA O PÉRDIDA DE OPERACIONES BASADAS EN EL ANÁLISIS TÉCNICO DE PRECIOS. ** **
¡Vamos allá!
Fuente de la imagen: binance.com
Fuente de la imagen: binance.com
Fuente de la imagen: binance.com
Como puede ver en los gráficos anteriores, el promedio móvil de 7 días está por debajo de EMA 21. Esto puede indicar una tendencia de corrección de precios, como suele ser el caso cuando los promedios a corto plazo (EMA 7) están por encima de otros promedios. A la larga, esto probablemente indica una bandera alcista en los precios y cuando cruza hacia abajo tenemos lo contrario. Por lo tanto, como tenemos EMA 7 por debajo de EMA 21, aún podemos tener algunas correcciones y caídas de precios, aunque creo que esta corrección (si corresponde) debería ser bastante pequeña.
El RSI se lateraliza alrededor de 42.10, lo que puede indicar la finalización de la corrección reciente que tuvimos en los últimos 86 días en los precios de BTC.
Seguimos en un escenario algo confuso ya que los indicadores a largo plazo indican un aumento, mientras que los indicadores a corto plazo indican una disminución. Esto puede traducirse en una posible continuación de la tendencia de corrección de precios que podemos observar desde el 6/26/2019, cuando alcanzamos el ATH (All Time Heights) de esta última ola (pero no fue el histórico BTC ATH).
El final de este canal de tendencia (independientemente del tipo de vista utilizado) ocurrió hoy (21/09/2019) y el mercado aún está lateralizado. Esto es un poco extraño, ya que debería haber habido algún movimiento. El triángulo que se formó suele ser una bandera de alto precio. Personalmente, creo que estamos en una fase de acumulación y que, en cualquier momento, el BTC reanudará la ruta de los precios altos. Sin embargo, como el triángulo ascendente se rompió solo hoy, debemos esperar a que se confirme esta tendencia.
NOTA: El canal de tendencia de precios se ha ajustado para reflejar la corrección que tuvimos el 28/08/2019 y el 19/09/2019.
Para resumir: debido a todos estos indicadores, todavía creo que hay espacio para una posible corrección de los precios de BTC (tanto a corto como a mediano y largo plazo), a pesar de la corrección reciente que tuvimos en los últimos días en torno al 27.33%.
¿Te gustó este contenido? Ayúdame a mantener la calidad y las publicaciones regulares donando cualquier cantidad en BTC, ETH o Doge a una de las carteras a continuación.
BTC wallet
ETH wallet
DOGE wallet:
STEEM wallet: @aotearoa
SBD wallet: @aotearoa
¡Juntos podemos hacer que #Steemit crezca aún más fuerte y más rápido!
Mensajes recientes:
My Actifit Report Card: September 18 2019
My Actifit Report Card: September 15 2019
ENGLISH VERSION:
Good morning Steemians, how do you do?
In today's post, I will do another technical analysis of BTC pricing, based on the classic tool of exponential moving averages, trend channels, and RSI.
To perform this analysis, I used Binance's candlestick chart views for 1 day, 1 week and 1 month respectively, along with the exponential average curves of 7, 21, 50 and 200 days, price trend channel. and RSI since 04/02/2019. So I have a broader scope to be able to do a safer analysis with a larger historical series. Remember that this analysis aims at the medium and long term.
Exponential moving averages are the average prices for a given period of time, with the most recent period having the greatest weight in curve making. Thus, in addition to providing a visualization of a trend, they react more quickly taking into account short-term market price volatility.
7-day exponential moving average (EMA 7): dark blue
21-day exponential moving average (EMA 21): yellow
50-day exponential moving average (EMA 50): Red
200-day exponential moving average (EMA 200): Turquoise
Trend Channel: Dark green Lines
** PLEASE NOTE: THIS POST HAS ONLY AN EDUCATIONAL OBJECTIVE AND SHOULD NOT BE BASED ON INVESTMENT DECISIONS. THE ANALYSIS REFERS TO MY OPINION ONLY AND I AM NOT RESPONSIBLE FOR ANY GAIN OR LOSS OF OPERATIONS BASED ON TECHNICAL PRICE ANALYSIS. **
Come on!
Image Source: binance.com
Image Source: binance.com
Image Source: binance.com
As you can see from the graphs above, the 7-day moving average is below EMA 21. This may indicate a price correction trend, as is usually the case when short-term averages (EMA 7) are above other averages. In the long run this probably indicates a bullish flag in prices and when it crosses down we have the opposite. Therefore, as we have EMA 7 below EMA 21, we may still have some corrections and price declines, although I believe this correction (if any) should be quite small.
The RSI is lateralized around 42.10, which may indicate the completion of the recent correction we had over the past 86 days in BTC prices.
We remain in a somewhat confusing scenario as long-term indicators indicate an increase while short-term indicators indicate a decline. This may translate into a possible continuation of the price correction trend that we can observe since 6/26/2019, when we hit the ATH (All Time Heights) of this last wave (but it was not the historic BTC ATH).
The end of this trend channel (regardless of the type of view used) occurred today (09/21/2019) and the market is still lateralized. This is a bit odd, as there should have been some movement. The triangle that had formed is usually a high-price flag. I personally believe that we are in an accumulation phase and that, at any moment, the BTC will resume the high price route. However as the upward triangle was broken only today we need to wait for this trend to be confirmed.
NOTE: The price trend channel has been adjusted to reflect the correction we had on 08/28/2019 and 09/19/2019.
To summarize: Due to all these indicators, I still believe that there is room for a possible correction of BTC prices (both in the short and medium and long term), despite the recent correction we had in recent days around 27.33%.
Did you like this content? Please help me maintain quality and regular posts by donating any amount in BTC, ETH or Doge to one of the portfolios below.
BTC wallet
ETH wallet
DOGE wallet:
STEEM wallet: @aotearoa
SBD wallet: @aotearoa
Together we can make #Steemit grow even stronger and faster!
Recent Posts:
My Actifit Report Card: September 18 2019
My Actifit Report Card: September 15 2019

ptgram power: | faça parte | grupos | projetos | membros |
| ptg shares | trilha premium | fórum externo | fórum na blockchain |
siga: | @brazine | @brazilians | @camoes | @coiotes | @dailycharity | @imagemvirtual | @msp-brasil | @ptgram-power |
Obrigado por postar! Esse comentário é o novo bot que dará upvote 100% para todos os posts que usam a tag #pt.
This post has been promoted with @minnowbooster.
5% of the purchase will be burned and 5% sent to the @steem.dao fund as part of our ethical promotion initiative.
For further information please check this post.
This post has been promoted with @minnowbooster.
5% of the purchase will be burned and 5% sent to the @steem.dao fund as part of our ethical promotion initiative.
For further information please check this post.
This post has been promoted with @minnowbooster.
5% of the purchase will be burned and 5% sent to the @steem.dao fund as part of our ethical promotion initiative.
For further information please check this post.
This post has been promoted with @minnowbooster.
5% of the purchase will be burned and 5% sent to the @steem.dao fund as part of our ethical promotion initiative.
For further information please check this post.
This post has been promoted with @minnowbooster.
5% of the purchase will be burned and 5% sent to the @steem.dao fund as part of our ethical promotion initiative.
For further information please check this post.
This post has been promoted with @minnowbooster.
5% of the purchase will be burned and 5% sent to the @steem.dao fund as part of our ethical promotion initiative.
For further information please check this post.
This post has been promoted with @minnowbooster.
5% of the purchase will be burned and 5% sent to the @steem.dao fund as part of our ethical promotion initiative.
For further information please check this post.
Voce recebeu um voto 100% de @brwhale e o restem de seu post por usar a tag #pt!
Obrigado pelo upvote @brwhale!
This post has been promoted with @minnowbooster.
5% of the purchase will be burned and 5% sent to the @steem.dao fund as part of our ethical promotion initiative.
For further information please check this post.