Using the Past to Predict the Future: The 123 Formation

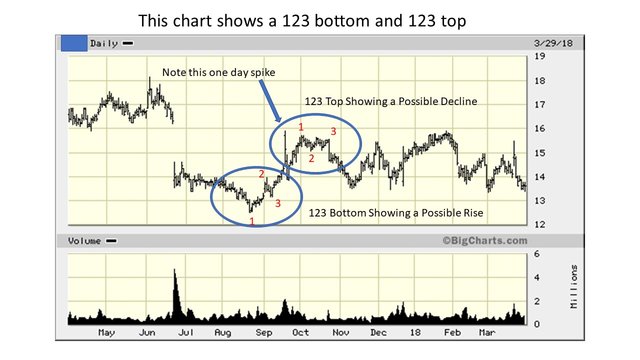
The first chart formation I learned about was the 123 top or bottom chart history. This formation is also called a head and shoulders formation. The number of days to develop this formation varies, but 15-30 days should be a good limit for stocks, but I have used smaller time frames in commodities. There will be mini-123’s within this time frame but 15-30 days is a good value to begin our discussions. The time frame is important because you are looking for a forming trend. Small 123’s can take place within a day’s time if you chart by the hour. This may be your interest, to be a day trader. However, I would stay away from day trading and speculation. These are the folks you hope to take money away from. This formation is used in both stocks and commodities trading. Below you will find a chart that displays the 123 bottom and top formation where the stock or commodity future might be trending up. And then down again.

The above chart tells me that the 123 bottom is indicating a possible rise in the price of this investment opportunity so when the price begins to rise from the #3 position I will place a stop-buy, limit, AON (all or none), GTC (good til cancelled) order just above the #2 position price. So if the #2 position high for that trading day was $14 a share I would set my buy order at $14.09 per share. I avoid round numbers because there may be 1000 buy orders sitting on $14.10 and I don’t want the price to blow right by 14.10 and lose my chance to get into the market. Call it placing my orders away from the crowd if you will. I do the same in a short-sell. If I were in a short position and I wanted to get out of the market using a market order for a stop-loss I would use $14.11 to trigger my order. There will be more later on the fine art of order placement. Placing an order to exit the market should it go against you is very important as well. One type of exit order I use is a trailing stop order. This order automatically moves the order trigger point when the market is going in a good way for you. A trailing stop-loss would have triggered on the one-day spike I’ve shown on the chart above. Believe reading the chart for signs of a coming trend is easier than placing an order to make the most of the opportunity. That is why we will be spending quite a bit of time on it.

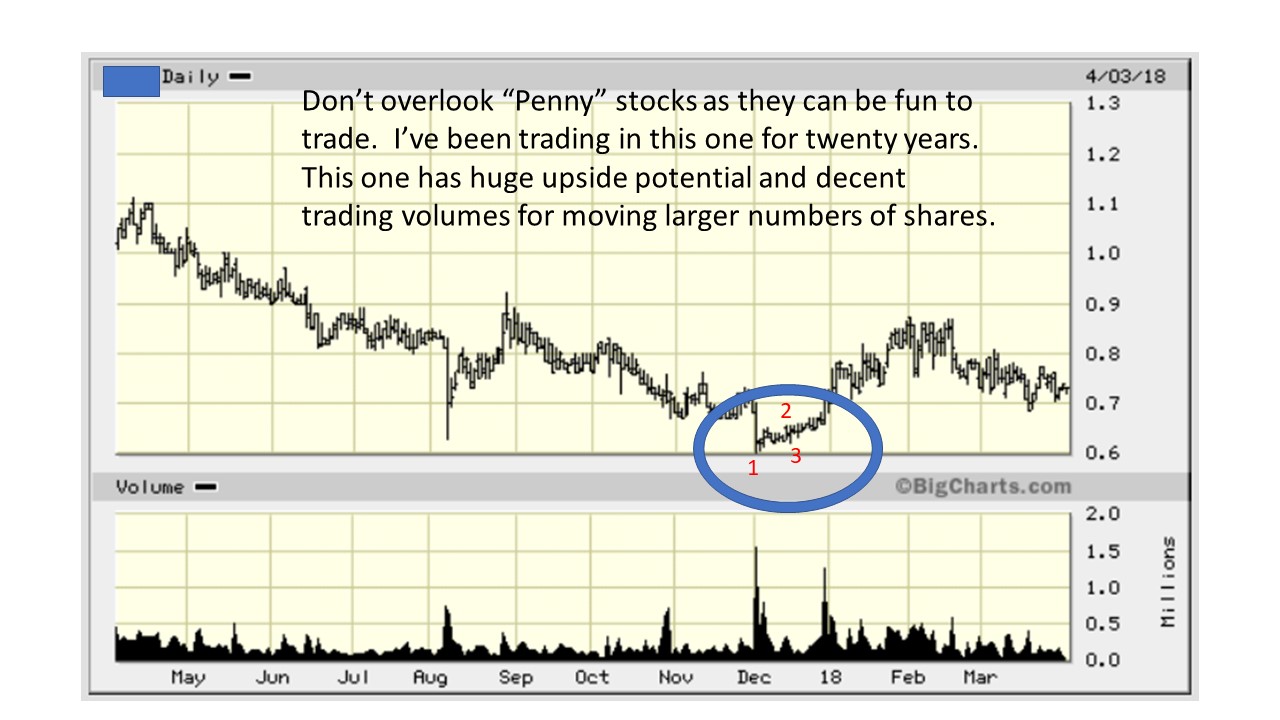
The chart above shows a penny stock that I’ve had some fun trading for about 20 years now. This is where I recommend new traders to start. The volumes are low enough that you will not have trouble filling your orders and the prices are low enough that when you make a mistake it won’t wipe you out. The 123 bottom I’ve circled is a bit short in time scale, but there none the less. It suggests a trend upward that we can see lasted for about 40 days. If you had entered the market at $0.66 a share and triggered a stop-loss a couple of days into February your gain would have been about $0.15 per share. Doesn’t seem like much, but that would have been a 20% increase in your investment in just 5 weeks. Not all opportunities have high yields, but hopefully you are starting to see the potential.
I found a youtube video that further explains the 123 top and bottom formations with more focus on the 123 bottom. I’ll explain further on the benefit of choosing long opportunities, at least in the stock market, in the final segment on order placement.
I selected the above youtube video which was made by someone I have no affiliation with. They do a pretty good job of explaining the 123. There are many others and I suggest you look at several to improve your chances of success.
In the next segment we will look at The Channel!
The charts above were screenshots from bigcharts.com with my own information inserted over the charts.
Previous and Upcoming releases:
Financial Charts: Using the Past to Predict the Future
https://steemit.com/newbieresteemday/@chuck2u32/financial-charts-using-the-past-to-predict-the-future
Using the Past to Predict the Future: Chartism History and Uses
https://steemit.com/newbieresteemday/@chuck2u32/using-the-past-to-predict-the-future-chartism-history-and-uses
Using the Past to Predict the Future: The 123 Formation
Using the Past to Predict the Future: The Channel
Using the Past to Predict the Future: The Break Point
Using the Past to Predict the Future: Long Term Strategies of Old Money
Using the Past to Predict the Future: Order Placement Strategies
Resources:
https://www.thechartist.com/
http://bigcharts.marketwatch.com/default.asp
http://futures.tradingcharts.com/menu.html
https://www.barchart.com/futures
https://en.wikipedia.org/wiki/Chartist_(occupation)
Beep! Beep! This humvee will be patrolling by and assisting new veterans, retirees, and military members here on Steem. @shadow3scalpel will help by upvoting posts from a list of members maintained by @chairborne and responding to any questions replied to this comment.
Thank you for the upvote, sir!
Agreed, we learn from the past as we compare, contrast, analyze it all through enough perspective, principle, towards seeing pattern. Bitcoin is rising as we abandon the Dollar and as the Rothschild fiat world crashes in many ways. Jesus is our Creator Savior. Thank for sharing, hehe. I'm Oatmeal Joey Arnold. You can call me Joey.
Nice to make your acquaintance, Joey! Thank you for the reply!