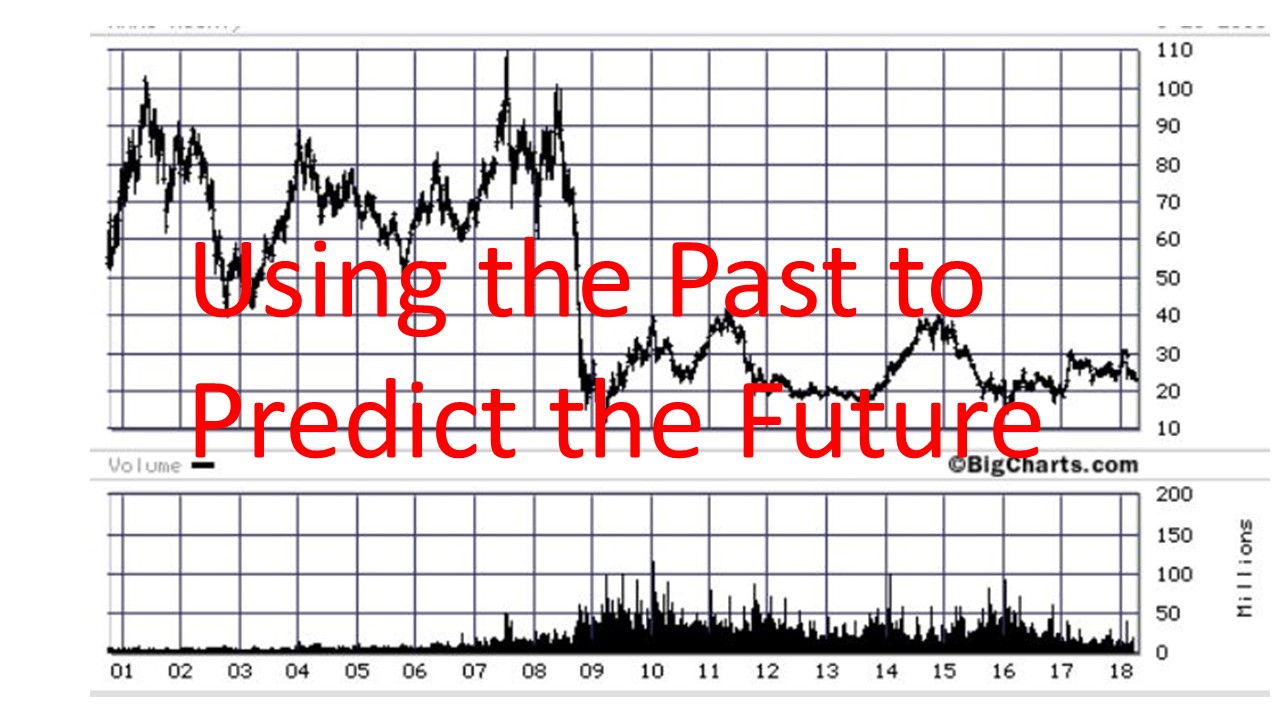
Using the Past to Predict the Future: Chartism History and Uses
Chartism, also known as technical trading, has been around as long as there have been financial charts. Reading them to predict where an investment opportunity is likely to trend is as much an art as it is a science. Stock markets exist for a variety of reasons and among them are that wealthy people can legally take money from other people to sustain their lavish lifestyles. Once you see in the charts what I will be telling you about in this series you will begin to know what to look for in these repeating strategies. At some point you will feel that the overwhelming knowledge required to make money isn’t so overwhelming anymore. In fact, it is surprisingly simple. Technical trading does not guarantee success, but it will make the possibilities seem less daunting.
For your reference a fundamentalist trader is the person who does analysis of individual companies and may or may not use that company’s charted history of stock prices. The thing I have never liked about fundamentalism is that you can spend a lot of time, even days or weeks, investigating a company and then decide that it does not offer an investment opportunity that you are interested in. With technical trading or chartism I can review many companies in a single hour and decide to invest in one or to keep looking. Realistically, I can review 15 companies in an hour, place a stop-limit order for that stock in 5 minutes and go on to something else like fishing with my grandson. It is also harder to develop “feelings” for one company over another. You don’t can about the company’s name or product or Mission Statement. The chart history is all you need to recognize an investment opportunity. I do some study of the company’s product and the product quality before finalizing my decision. This is done in a few minutes with a simple internet search.
Chartism uses chart histories to make several comparisons to include:
Comparing an investment opportunity against things considered to be “standards” like precious metals, the Dow Jones Industrial Average, Standard & Poor’s 500 company average, the US dollar, etc. An example of this would be to compare certain stocks that run opposite of the Dow Jones Industrial Average. I am currently in a long position in a stock that does not do well when the Dow is high, but will always do well when the stock market suffers a correction. So I buy the stock and wait for the correction. Compare gold to the Dow and take note of the difference the chart shows. Keep in mind that value-wise gold is gold and its value does not change. It is the paper currencies that fluctuate in value compared to gold.
Reviewing historic highs and lows for a particular investment opportunity. Obviously, investing in a long position when the opportunity is at historic highs may not be a wise thing to do. Up front, I’ll tell you that in stocks I don’t do short positions. I was paper trading a stock that was running in an interesting channel and I was considering playing a short position when it hit the top of the channel and then do a buy to exit and another buy at the bottom to move into a long position. The stock was trading in low volumes and just when I had done a pretend trade to a short position the next day some inexperienced trader placed a large market order for a large number of shares and to fill the order the price shot up to 11 times its value in about a second of what I sold it for. It came back down quickly, but if I had placed a stop loss at just above the channel, when my order would have been filled, it could have bankrupted me. The person who placed the order lost thousands paying an artificially high price. We’ll get more into order placement in Order Placement Strategies. We’ll also discuss paper trading.
The charts typically include trading volume. This is just as important as the price chart. This will tell you how interested in that investment people are. It tells you how many shares you can likely trade without running up (or down) the price of the shares. As an example if you own 1000 shares of a stock that only averages 500 shares a day that are traded, if you place a market order to buy or sell you almost always will pay more, or lose more money before all your shares sell. You also will have small traders picking off only a few shares of your holdings and you will get charged a brokerage fee for each trade. I’ll cover more on stock and commodity trades in the last segment of this series. How you place orders is extremely important.
Famous Technical Traders (Chartists)
http://blog.parlan.com/blog/the-top-20-stock-market-legends
These several famous investors began with the basic elements of chartism like I’m sharing here, but progressed to more advanced technical markers.
Check out this article for an advanced chartist formation (the golden cross): https://www.ft.com/content/2f325d8a-4d90-11e1-bb6c-00144feabdc0
In the next release we will discuss the 123 formation also known as the head and shoulders formation. Below I have placed some links to resources to help get you started.
Previous and Upcoming releases:
Financial Charts: Using the Past to Predict the Future
https://steemit.com/newbieresteemday/@chuck2u32/financial-charts-using-the-past-to-predict-the-future
Using the Past to Predict the Future: Chartism History and Uses
Using the Past to Predict the Future: The 123 Formation
Using the Past to Predict the Future: The Channel
Using the Past to Predict the Future: The Break Point
Using the Past to Predict the Future: Long Term Strategies of Old Money
Using the Past to Predict the Future: Finer Points of Chartism
Using the Past to Predict the Future: Order Placement Strategies
Resources:
https://www.thechartist.com/
http://bigcharts.marketwatch.com/default.asp
http://futures.tradingcharts.com/menu.html
https://www.barchart.com/futures
https://en.wikipedia.org/wiki/Chartist_(occupation)
